| Chain sequence(s) |
A: NFMLTQPHSVSESPGKTLTISCTGSSASIASHYVQWYSIDSSSNSASLTISGLKTEDEADYYCQSYDGNNHWVFGGG
input PDB |
| Selected Chain(s) | A |
| Distance of aggregation | 10 Å |
| FoldX usage | Yes |
| Dynamic mode | Yes |
| Automated mutations | No |
| Downloads | Download all the data |
| Simulation log |
[INFO]       Logger:   Verbosity set to: 2 - [INFO]                                                (00:00:02)
[WARNING]    runJob:   Working directory already exists (possibly overwriting previous results -ow
                       to prevent this behavior)                                                   (00:00:02)
[INFO]       runJob:   Starting aggrescan3d job on: input.pdb with A chain(s) selected             (00:00:02)
[INFO]       runJob:   Creating pdb object from: input.pdb                                         (00:00:02)
[INFO]       FoldX:    Starting FoldX energy minimalization                                        (00:00:02)
[INFO]       CABS:     Running CABS flex simulation                                                (00:00:23)
[INFO]       Analysis: Starting Aggrescan3D on model_10.pdb                                        (00:11:30)
[INFO]       Analysis: Starting Aggrescan3D on model_7.pdb                                         (00:11:30)
[INFO]       Analysis: Starting Aggrescan3D on model_9.pdb                                         (00:11:30)
[INFO]       Analysis: Starting Aggrescan3D on model_8.pdb                                         (00:11:31)
[INFO]       Analysis: Starting Aggrescan3D on model_11.pdb                                        (00:11:31)
[INFO]       Analysis: Starting Aggrescan3D on model_6.pdb                                         (00:11:31)
[INFO]       Analysis: Starting Aggrescan3D on model_4.pdb                                         (00:11:31)
[INFO]       Analysis: Starting Aggrescan3D on model_2.pdb                                         (00:11:31)
[INFO]       Analysis: Starting Aggrescan3D on model_5.pdb                                         (00:11:31)
[INFO]       Analysis: Starting Aggrescan3D on model_1.pdb                                         (00:11:32)
[INFO]       Analysis: Starting Aggrescan3D on model_0.pdb                                         (00:11:32)
[INFO]       Analysis: Starting Aggrescan3D on model_3.pdb                                         (00:11:32)
[INFO]       Analysis: Starting Aggrescan3D on input.pdb                                           (00:11:32)
[INFO]       Analysis: Starting Aggrescan3D on folded.pdb                                          (00:11:33)
[INFO]       Movie:    Creting movie with webm format                                              (00:12:57)
[INFO]       Main:     Simulation completed successfully.                                          (00:12:59)
|
The table below lists A3D score for protein residues. Residues with A3D score > 0.0000 are marked by yellow rows.
| residue index | residue name | chain | Aggrescan3D score | mutation |
|---|---|---|---|---|
| residue index | residue name | chain | Aggrescan3D score | |
| 1 | N | A | 0.0000 | |
| 2 | F | A | 0.0000 | |
| 3 | M | A | 0.0000 | |
| 4 | L | A | 0.0000 | |
| 5 | T | A | -0.1227 | |
| 6 | Q | A | 0.0000 | |
| 7 | P | A | 0.0521 | |
| 8 | H | A | -0.3088 | |
| 9 | S | A | 0.1616 | |
| 10 | V | A | 0.8972 | |
| 11 | S | A | -0.1112 | |
| 12 | E | A | -1.1834 | |
| 13 | S | A | 0.0000 | |
| 14 | P | A | -0.9297 | |
| 15 | G | A | 0.0000 | |
| 16 | K | A | -0.5757 | |
| 17 | T | A | 0.3510 | |
| 18 | L | A | 1.1920 | |
| 19 | T | A | 0.9861 | |
| 20 | I | A | 0.4200 | |
| 21 | S | A | 0.2593 | |
| 22 | C | A | 0.0000 | |
| 23 | T | A | 0.0000 | |
| 24 | G | A | 0.3437 | |
| 25 | S | A | 0.0293 | |
| 26 | S | A | 0.0000 | |
| 27 | A | A | 0.2227 | |
| 28 | S | A | 0.6124 | |
| 29 | I | A | 1.0807 | |
| 30 | A | A | 0.5007 | |
| 31 | S | A | 0.1780 | |
| 32 | H | A | 0.0647 | |
| 33 | Y | A | 0.0000 | |
| 34 | V | A | 0.0000 | |
| 35 | Q | A | 0.6656 | |
| 36 | W | A | 1.1110 | |
| 37 | Y | A | 1.0214 | |
| 66 | S | A | 0.0000 | |
| 67 | I | A | -0.1692 | |
| 68 | D | A | -1.4139 | |
| 69 | S | A | -1.1211 | |
| 70 | S | A | -1.0854 | |
| 71 | S | A | -0.8366 | |
| 72 | N | A | -0.5690 | |
| 73 | S | A | -0.1645 | |
| 74 | A | A | 0.3635 | |
| 75 | S | A | 0.4297 | |
| 76 | L | A | 1.3442 | |
| 77 | T | A | 1.1781 | |
| 78 | I | A | 1.4870 | |
| 79 | S | A | -0.0229 | |
| 80 | G | A | -0.8272 | |
| 81 | L | A | -1.2543 | |
| 82 | K | A | -2.4485 | |
| 83 | T | A | -1.9482 | |
| 84 | E | A | -2.2027 | |
| 85 | D | A | -3.3067 | |
| 86 | E | A | -3.1143 | |
| 87 | A | A | -1.4224 | |
| 88 | D | A | -0.5669 | |
| 89 | Y | A | 1.3477 | |
| 90 | Y | A | 2.2961 | |
| 91 | C | A | 2.3276 | |
| 92 | Q | A | 0.0000 | |
| 93 | S | A | 0.0609 | |
| 94 | Y | A | -0.3314 | |
| 95 | D | A | -2.0885 | |
| 96 | G | A | -1.8853 | |
| 97 | N | A | -1.4762 | |
| 98 | N | A | -1.1415 | |
| 99 | H | A | 0.3105 | |
| 100 | W | A | 2.0285 | |
| 101 | V | A | 2.9278 | |
| 102 | F | A | 1.8739 | |
| 103 | G | A | 0.2590 | |
| 104 | G | A | -0.9101 | |
| 105 | G | A | -1.0573 |
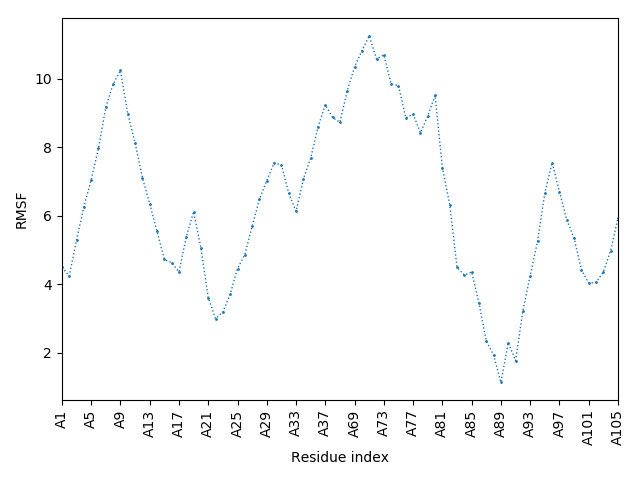
CABS-flex predictions of flexibility of input structure
In dynamic mode, A3D analysis is performed on the set of models reflecting fluctuations of the input structure (predicted
by CABS-flex method, models are numbered from 0 to 11) and the input model.
Their A3D scores are provided below in the table.
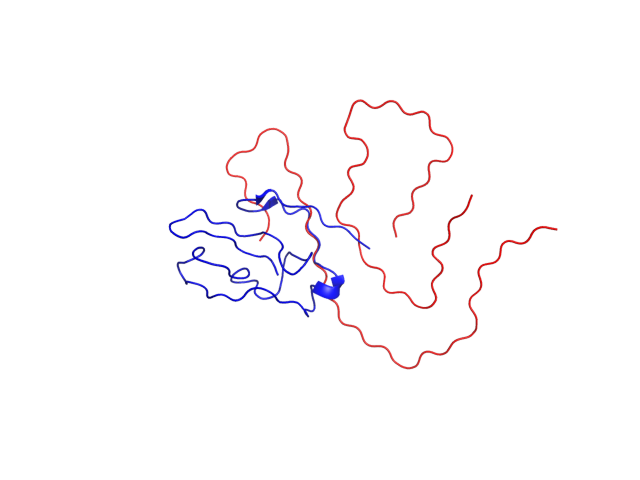
The right panel presents comparison of the most aggregation prone model (with the highest A3D score, -0.0807 in this case) with the input model
(the most aggregation prone model in blue, input in red) and RMSF plot which shows the extent of residue fluctuations in Angstroms (predicted by CABS-flex).
Model |
Average A3D Score |
|||
| model_11 | -0.0807 | View | CSV | PDB |
| input | -0.0924 | View | CSV | PDB |
| model_0 | -0.1467 | View | CSV | PDB |
| model_1 | -0.1669 | View | CSV | PDB |
| model_5 | -0.2068 | View | CSV | PDB |
| model_2 | -0.2922 | View | CSV | PDB |
| model_8 | -0.3133 | View | CSV | PDB |
| model_3 | -0.317 | View | CSV | PDB |
| model_4 | -0.3172 | View | CSV | PDB |
| model_10 | -0.3277 | View | CSV | PDB |
| model_7 | -0.3318 | View | CSV | PDB |
| model_6 | -0.3572 | View | CSV | PDB |
| model_9 | -0.3756 | View | CSV | PDB |

