Status: Done started: 2018-Feb-12 12:20:09 UTC
| Project Name | smitainfo |
| Sequence | MAHFPGFGQS LLFGYPVYVF GDCVQGDWCP ISGGLCSARL HRHALLATCP EHQITWDPID GRVIGSALQF LIPRLPSFPT QRTSKTLKVL TPPITHTTPN IPPSFLQAMR KYSPFRNGYM EPTLGQHLPT LSFPDPGLRP QNLYTLWGGS VVCMYLYQLS PPITWPLLPH VIFCHPGQLG AFLTNVPYKR IEKLLYKISL TTGALIILPE DCLPTTLFQP ARAPVTLTAW QNGLLPFHST LTTPGLIWTF TDGTPMISGP CPKDGQPSLV LQSSSFIFHK FQTKAYHPSF LLSHGLIQYS SFHNLHLLFE EYTNIPISLL FNEKEADDND HEPQISPGGL EPLSEKHFRE TEV |
| Secondary structure | CCCCCCCCCC EECCCCEEEC CCCCCEEECC CCCCCCCCCC CCCCCCCCCC CCCCCCCCCC CCCCCCCCCC CCCCCCCCCC CCCCCCCCCC CCCCCCCCCC CCCCCCCCCC CCCCCCCCCC CCCCCCCCCC CCCCCCCCCC CCCCCCCCCC CCCCCCCCCC CCCCCCCCCC CCCCCCCCCC CCCCCCCCCC CCCCCCCCCC CCCCCCCCCC CCCCCCCCCC CCCCCCCCCC CCCCCCCCCC CCCCCCCCCC CCCCCCCCCC CCCCCCCCCC CCCCCCCCCC EEEEEECCCC CCCCCCCCCE ECCCCCCEEC CCCCCCEEEE ECCCCCCCCC CCCCCCEEEE CCCCCCCCCC CCC |
| Movie from predicted structures | To download the movie, right click on the desired file format:  
|
| Estimated finish time | 2018-Feb-12 16:25 UTC |
| Project Name | smitainfo |
| Project Name | smitainfo |
| Cluster # | 1 | 2 | 3 | 4 | 5 | 6 | 7 | 8 | 9 | 10 | 11 | 12 |
| Cluster density | 173.9 | 137.3 | 135.0 | 131.7 | 130.0 | 117.2 | 108.0 | 106.0 | 97.5 | 88.4 | 85.1 | 65.6 |
| Cluster size | 245 | 203 | 198 | 194 | 181 | 163 | 157 | 162 | 142 | 129 | 127 | 99 |
| Average cluster RMSD | 1.4 | 1.5 | 1.5 | 1.5 | 1.4 | 1.4 | 1.5 | 1.5 | 1.5 | 1.5 | 1.5 | 1.5 |
| # | 1 | 2 | 3 | 4 | 5 | 6 | 7 | 8 | 9 | 10 | 11 | 12 |
| RMSD | 3.44 | 3.47 | 3.66 | 3.76 | 3.83 | 3.91 | 3.77 | 3.50 | 3.71 | 3.36 | 3.57 | 3.31 |
| GDT_TS | 0.54 | 0.56 | 0.53 | 0.51 | 0.54 | 0.51 | 0.53 | 0.54 | 0.52 | 0.58 | 0.55 | 0.55 |
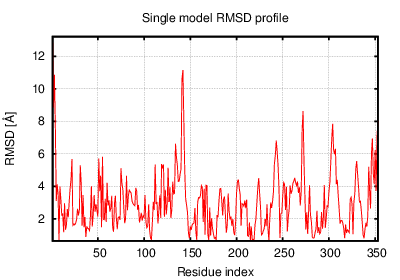
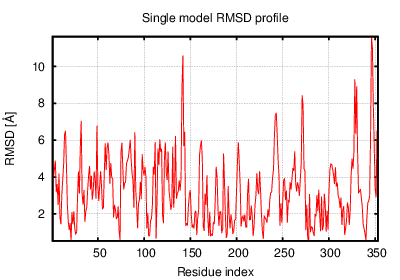
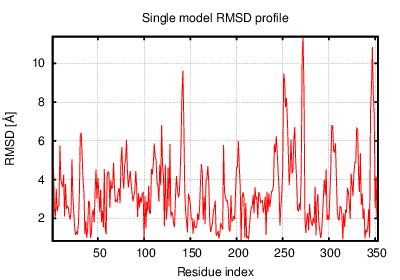
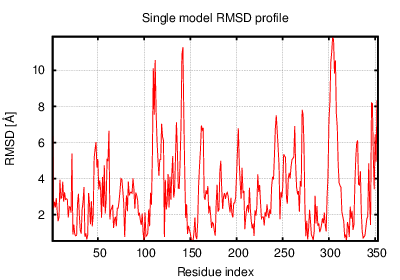
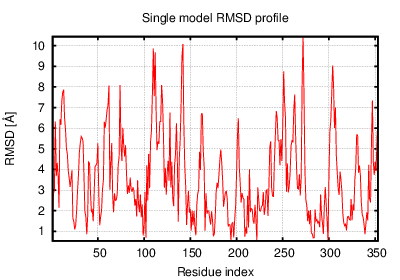
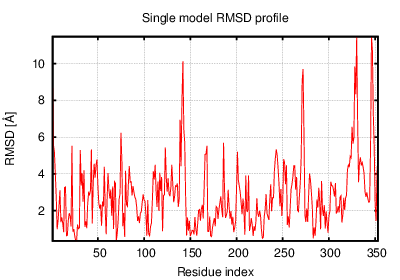
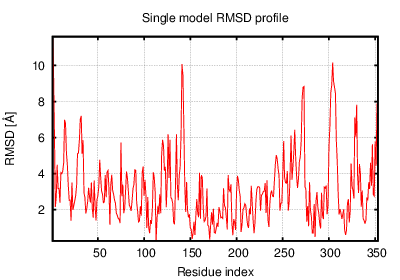
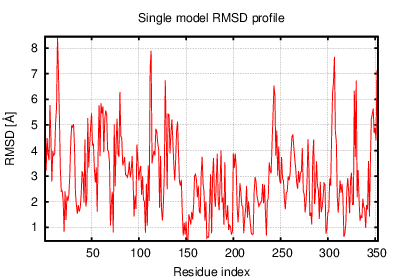
The table contains RMSD and GDT_TS values (calculated on the Cα atoms) between the predicted models and the input structure. Note that GDT_TS metric is intended as a more accurate measurement than the more common RMSD.
Read more about the root-mean-square deviation (RMSD) measure
Read more about the global distance test (GDT, also written as GDT_TS to represent "total score") measure.
| # | 1 | 2 | 3 | 4 | 5 | 6 | 7 | 8 | 9 | 10 | 11 | 12 |
| 1 | 0.00 | 2.96 | 3.47 | 3.83 | 2.48 | 2.83 | 3.51 | 2.65 | 2.54 | 3.19 | 3.18 | 2.97 |
| 2 | 2.96 | 0.00 | 3.01 | 3.26 | 2.78 | 3.56 | 2.84 | 2.88 | 3.56 | 3.01 | 2.89 | 2.92 |
| 3 | 3.47 | 3.01 | 0.00 | 3.57 | 3.35 | 3.88 | 2.96 | 3.29 | 3.79 | 2.71 | 2.93 | 2.98 |
| 4 | 3.83 | 3.26 | 3.57 | 0.00 | 3.39 | 3.44 | 3.00 | 3.45 | 4.11 | 3.21 | 3.74 | 3.84 |
| 5 | 2.48 | 2.78 | 3.35 | 3.39 | 0.00 | 2.54 | 3.25 | 2.66 | 2.95 | 3.21 | 3.12 | 3.22 |
| 6 | 2.83 | 3.56 | 3.88 | 3.44 | 2.54 | 0.00 | 3.68 | 3.18 | 2.69 | 3.72 | 3.71 | 3.72 |
| 7 | 3.51 | 2.84 | 2.96 | 3.00 | 3.25 | 3.68 | 0.00 | 3.08 | 3.88 | 2.80 | 3.34 | 3.36 |
| 8 | 2.65 | 2.88 | 3.29 | 3.45 | 2.66 | 3.18 | 3.08 | 0.00 | 2.79 | 3.30 | 3.17 | 3.19 |
| 9 | 2.54 | 3.56 | 3.79 | 4.11 | 2.95 | 2.69 | 3.88 | 2.79 | 0.00 | 3.96 | 3.81 | 3.54 |
| 10 | 3.19 | 3.01 | 2.71 | 3.21 | 3.21 | 3.72 | 2.80 | 3.30 | 3.96 | 0.00 | 3.02 | 3.09 |
| 11 | 3.18 | 2.89 | 2.93 | 3.74 | 3.12 | 3.71 | 3.34 | 3.17 | 3.81 | 3.02 | 0.00 | 2.69 |
| 12 | 2.97 | 2.92 | 2.98 | 3.84 | 3.22 | 3.72 | 3.36 | 3.19 | 3.54 | 3.09 | 2.69 | 0.00 |
The table contains RMSD values (calculated on the Cα atoms) between the predicted models.
Read more about the root-mean-square deviation (RMSD) measure.
| # | 1 | 2 | 3 | 4 | 5 | 6 | 7 | 8 | 9 | 10 | 11 | 12 |
| 1 | 1.00 | 0.63 | 0.57 | 0.56 | 0.69 | 0.66 | 0.57 | 0.64 | 0.66 | 0.62 | 0.60 | 0.60 |
| 2 | 0.63 | 1.00 | 0.62 | 0.60 | 0.65 | 0.57 | 0.64 | 0.63 | 0.55 | 0.63 | 0.63 | 0.64 |
| 3 | 0.57 | 0.62 | 1.00 | 0.56 | 0.58 | 0.52 | 0.61 | 0.58 | 0.55 | 0.65 | 0.63 | 0.63 |
| 4 | 0.56 | 0.60 | 0.56 | 1.00 | 0.61 | 0.57 | 0.58 | 0.56 | 0.51 | 0.59 | 0.56 | 0.56 |
| 5 | 0.69 | 0.65 | 0.58 | 0.61 | 1.00 | 0.67 | 0.57 | 0.65 | 0.64 | 0.59 | 0.60 | 0.60 |
| 6 | 0.66 | 0.57 | 0.52 | 0.57 | 0.67 | 1.00 | 0.52 | 0.58 | 0.66 | 0.52 | 0.58 | 0.54 |
| 7 | 0.57 | 0.64 | 0.61 | 0.58 | 0.57 | 0.52 | 1.00 | 0.57 | 0.51 | 0.62 | 0.58 | 0.58 |
| 8 | 0.64 | 0.63 | 0.58 | 0.56 | 0.65 | 0.58 | 0.57 | 1.00 | 0.61 | 0.58 | 0.59 | 0.58 |
| 9 | 0.66 | 0.55 | 0.55 | 0.51 | 0.64 | 0.66 | 0.51 | 0.61 | 1.00 | 0.54 | 0.54 | 0.55 |
| 10 | 0.62 | 0.63 | 0.65 | 0.59 | 0.59 | 0.52 | 0.62 | 0.58 | 0.54 | 1.00 | 0.61 | 0.61 |
| 11 | 0.60 | 0.63 | 0.63 | 0.56 | 0.60 | 0.58 | 0.58 | 0.59 | 0.54 | 0.61 | 1.00 | 0.65 |
| 12 | 0.60 | 0.64 | 0.63 | 0.56 | 0.60 | 0.54 | 0.58 | 0.58 | 0.55 | 0.61 | 0.65 | 1.00 |
The table contains GDT_TS values (calculated on the Cα atoms) between the predicted models.
Read more about the global distance test (GDT, also written as GDT_TS to represent "total score") measure.
© Laboratory of Theory of Biopolymers, Faculty of Chemistry, University of Warsaw 2013