Status: Done started: 2018-Jan-11 07:54:50 UTC
| Project Name | KAVI-4CXL |
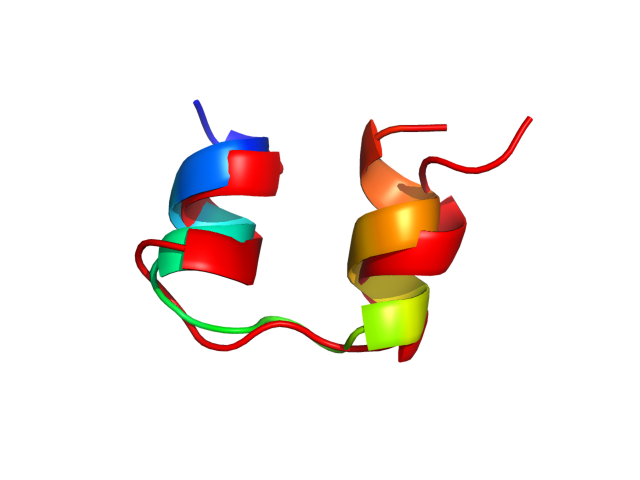
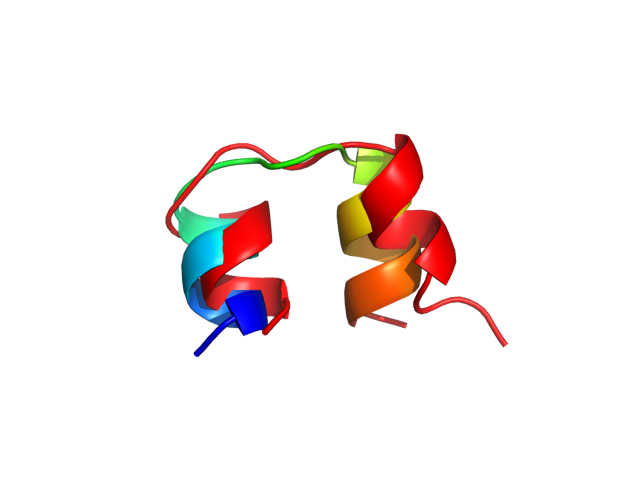
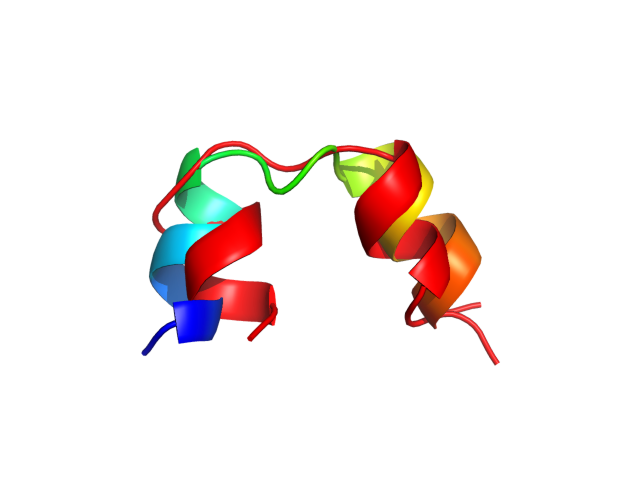
| Sequence | GIVEQCCTSI CSLYQLENYC N |
| Secondary structure | CHHHHHCCCC CCHHHHHCCC C |
| Movie from predicted structures | To download the movie, right click on the desired file format:  
|
| Estimated finish time | 2018-Jan-11 11:16 UTC |
| Project Name | KAVI-4CXL |
| Project Name | KAVI-4CXL |
| Cluster # | 1 | 2 | 3 | 4 | 5 | 6 | 7 | 8 | 9 | 10 | 11 | 12 |
| Cluster density | 310.7 | 303.6 | 291.8 | 145.9 | 144.1 | 137.8 | 116.1 | 99.8 | 82.0 | 79.4 | 57.6 | 40.3 |
| Cluster size | 331 | 288 | 278 | 172 | 174 | 195 | 129 | 113 | 98 | 90 | 85 | 47 |
| Average cluster RMSD | 1.1 | 0.9 | 1.0 | 1.2 | 1.2 | 1.4 | 1.1 | 1.1 | 1.2 | 1.1 | 1.5 | 1.2 |
| # | 1 | 2 | 3 | 4 | 5 | 6 | 7 | 8 | 9 | 10 | 11 | 12 |
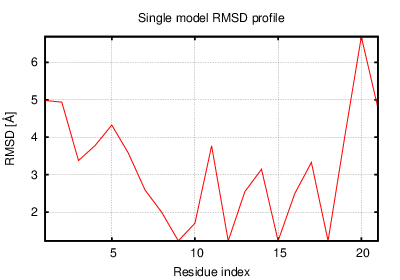
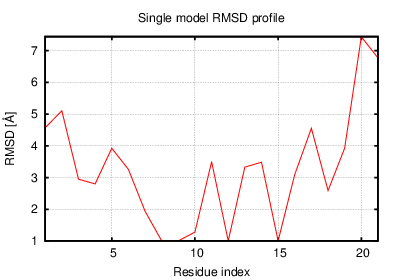
| RMSD | 2.49 | 3.22 | 3.14 | 2.33 | 2.95 | 2.82 | 3.62 | 2.17 | 2.96 | 3.53 | 3.00 | 3.73 |
| GDT_TS | 0.74 | 0.67 | 0.65 | 0.76 | 0.67 | 0.71 | 0.62 | 0.82 | 0.70 | 0.64 | 0.73 | 0.69 |
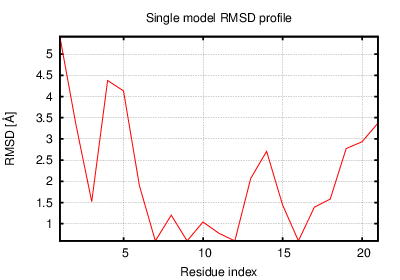
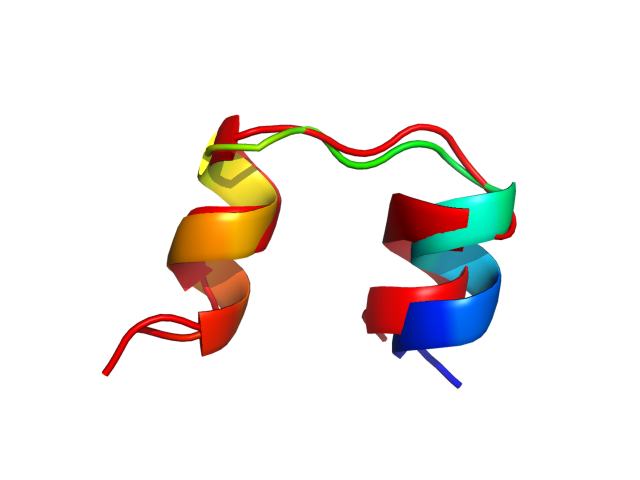
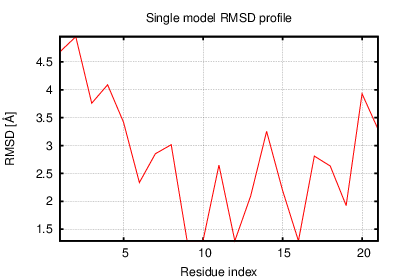
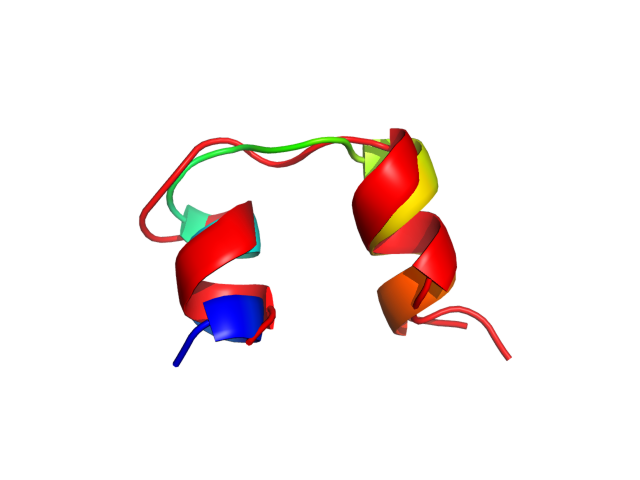
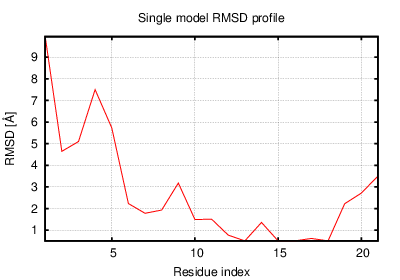
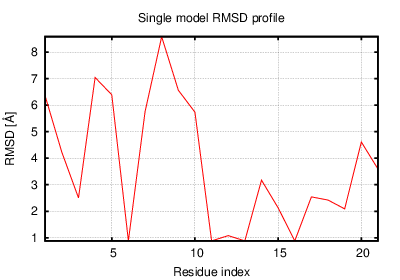
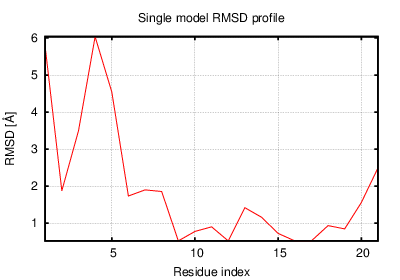
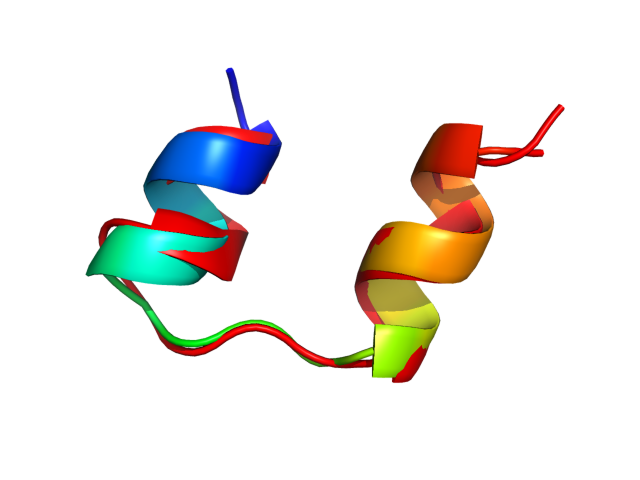
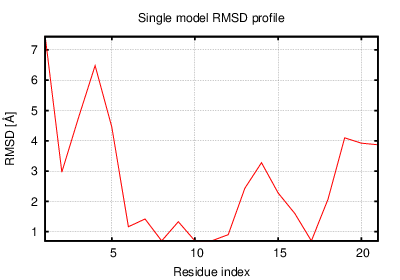
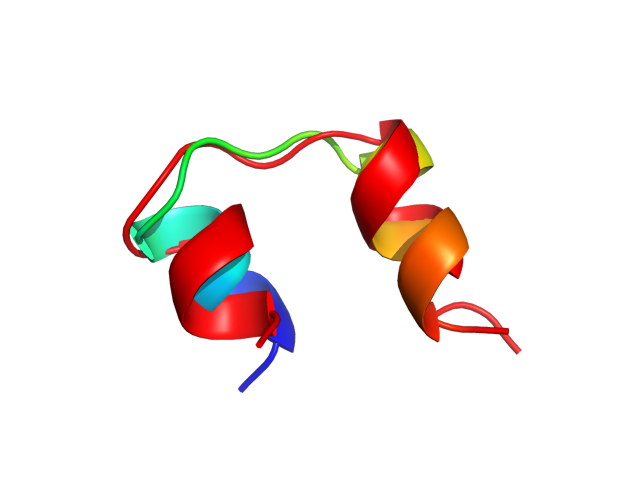
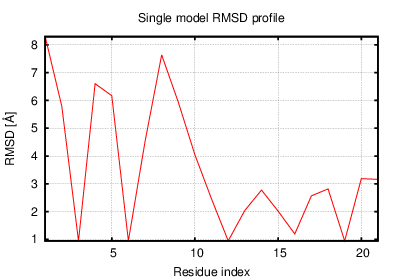
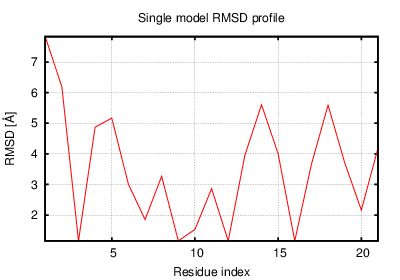
The table contains RMSD and GDT_TS values (calculated on the Cα atoms) between the predicted models and the input structure. Note that GDT_TS metric is intended as a more accurate measurement than the more common RMSD.
Read more about the root-mean-square deviation (RMSD) measure
Read more about the global distance test (GDT, also written as GDT_TS to represent "total score") measure.
| # | 1 | 2 | 3 | 4 | 5 | 6 | 7 | 8 | 9 | 10 | 11 | 12 |
| 1 | 0.00 | 1.35 | 1.53 | 1.25 | 1.43 | 1.76 | 2.13 | 1.00 | 1.82 | 2.34 | 1.55 | 2.59 |
| 2 | 1.35 | 0.00 | 0.83 | 1.87 | 1.22 | 2.08 | 1.53 | 1.83 | 2.42 | 1.92 | 1.78 | 2.50 |
| 3 | 1.53 | 0.83 | 0.00 | 2.04 | 1.06 | 2.39 | 1.20 | 2.03 | 2.85 | 1.79 | 1.91 | 2.66 |
| 4 | 1.25 | 1.87 | 2.04 | 0.00 | 1.78 | 1.40 | 2.54 | 1.17 | 1.78 | 2.38 | 1.74 | 2.13 |
| 5 | 1.43 | 1.22 | 1.06 | 1.78 | 0.00 | 2.54 | 1.13 | 1.79 | 2.89 | 1.29 | 1.85 | 2.15 |
| 6 | 1.76 | 2.08 | 2.39 | 1.40 | 2.54 | 0.00 | 3.15 | 1.75 | 1.30 | 3.17 | 2.10 | 2.99 |
| 7 | 2.13 | 1.53 | 1.20 | 2.54 | 1.13 | 3.15 | 0.00 | 2.58 | 3.56 | 1.24 | 2.34 | 2.47 |
| 8 | 1.00 | 1.83 | 2.03 | 1.17 | 1.79 | 1.75 | 2.58 | 0.00 | 1.90 | 2.52 | 1.73 | 2.72 |
| 9 | 1.82 | 2.42 | 2.85 | 1.78 | 2.89 | 1.30 | 3.56 | 1.90 | 0.00 | 3.46 | 2.31 | 3.06 |
| 10 | 2.34 | 1.92 | 1.79 | 2.38 | 1.29 | 3.17 | 1.24 | 2.52 | 3.46 | 0.00 | 2.41 | 1.70 |
| 11 | 1.55 | 1.78 | 1.91 | 1.74 | 1.85 | 2.10 | 2.34 | 1.73 | 2.31 | 2.41 | 0.00 | 2.44 |
| 12 | 2.59 | 2.50 | 2.66 | 2.13 | 2.15 | 2.99 | 2.47 | 2.72 | 3.06 | 1.70 | 2.44 | 0.00 |
The table contains RMSD values (calculated on the Cα atoms) between the predicted models.
Read more about the root-mean-square deviation (RMSD) measure.
| # | 1 | 2 | 3 | 4 | 5 | 6 | 7 | 8 | 9 | 10 | 11 | 12 |
| 1 | 1.00 | 0.86 | 0.84 | 0.88 | 0.87 | 0.81 | 0.80 | 0.90 | 0.82 | 0.76 | 0.88 | 0.75 |
| 2 | 0.86 | 1.00 | 0.95 | 0.81 | 0.88 | 0.81 | 0.86 | 0.80 | 0.74 | 0.83 | 0.86 | 0.76 |
| 3 | 0.84 | 0.95 | 1.00 | 0.81 | 0.92 | 0.75 | 0.90 | 0.80 | 0.73 | 0.83 | 0.81 | 0.74 |
| 4 | 0.88 | 0.81 | 0.81 | 1.00 | 0.81 | 0.87 | 0.76 | 0.92 | 0.83 | 0.77 | 0.92 | 0.80 |
| 5 | 0.87 | 0.88 | 0.92 | 0.81 | 1.00 | 0.76 | 0.89 | 0.82 | 0.75 | 0.87 | 0.83 | 0.80 |
| 6 | 0.81 | 0.81 | 0.75 | 0.87 | 0.76 | 1.00 | 0.74 | 0.83 | 0.86 | 0.71 | 0.82 | 0.73 |
| 7 | 0.80 | 0.86 | 0.90 | 0.76 | 0.89 | 0.74 | 1.00 | 0.76 | 0.69 | 0.90 | 0.76 | 0.77 |
| 8 | 0.90 | 0.80 | 0.80 | 0.92 | 0.82 | 0.83 | 0.76 | 1.00 | 0.80 | 0.76 | 0.90 | 0.74 |
| 9 | 0.82 | 0.74 | 0.73 | 0.83 | 0.75 | 0.86 | 0.69 | 0.80 | 1.00 | 0.70 | 0.81 | 0.73 |
| 10 | 0.76 | 0.83 | 0.83 | 0.77 | 0.87 | 0.71 | 0.90 | 0.76 | 0.70 | 1.00 | 0.77 | 0.86 |
| 11 | 0.88 | 0.86 | 0.81 | 0.92 | 0.83 | 0.82 | 0.76 | 0.90 | 0.81 | 0.77 | 1.00 | 0.76 |
| 12 | 0.75 | 0.76 | 0.74 | 0.80 | 0.80 | 0.73 | 0.77 | 0.74 | 0.73 | 0.86 | 0.76 | 1.00 |
The table contains GDT_TS values (calculated on the Cα atoms) between the predicted models.
Read more about the global distance test (GDT, also written as GDT_TS to represent "total score") measure.
© Laboratory of Theory of Biopolymers, Faculty of Chemistry, University of Warsaw 2013