Status: Done started: 2018-May-15 11:32:42 UTC
| Project Name | VVD_lit |
| Sequence | TLYAPGGYDI MGYLIQIMNR PNPQVELGPV DTSCALILCD LKQKDTPIVY ASEAFLYMTG YSNAEVLGRN CRFLQSPDGM VKPKSTRKYV DSNTINTMRK AIDRNAEVQV EVVNFKKNGQ RFVNFLTMIP VRDETGEYRY SMGFQCE |
| Secondary structure | CCCCCCCCCH HHHHHHHHCC CCCCCCCCCC CCCCEEEEEE CCCCCCCEEE ECHHHHHHHC CCHHHHCCCC CCCCCCCCCC CCCCCCCCCC CHHHHHHHHH HHHHCCCEEE EEEEECCCCC EEEEEEEEEE EECCCCCEEE EEEEECC |
| Movie from predicted structures | To download the movie, right click on the desired file format:  
|
| Estimated finish time | 2018-May-15 16:11 UTC |
| Project Name | VVD_lit |


| Project Name | VVD_lit |
| Cluster # | 1 | 2 | 3 | 4 | 5 | 6 | 7 | 8 | 9 | 10 | 11 | 12 |
| Cluster density | 154.9 | 142.6 | 136.7 | 133.1 | 121.3 | 113.8 | 101.5 | 100.9 | 92.0 | 64.6 | 59.5 | 54.1 |
| Cluster size | 235 | 218 | 217 | 213 | 195 | 179 | 155 | 155 | 151 | 106 | 92 | 84 |
| Average cluster RMSD | 1.5 | 1.5 | 1.6 | 1.6 | 1.6 | 1.6 | 1.5 | 1.5 | 1.6 | 1.6 | 1.5 | 1.6 |
| # | 1 | 2 | 3 | 4 | 5 | 6 | 7 | 8 | 9 | 10 | 11 | 12 |
| RMSD | 3.19 | 3.14 | 3.40 | 3.28 | 3.37 | 3.43 | 3.06 | 3.54 | 3.43 | 3.33 | 3.04 | 3.35 |
| GDT_TS | 0.67 | 0.65 | 0.63 | 0.69 | 0.63 | 0.64 | 0.69 | 0.65 | 0.63 | 0.66 | 0.66 | 0.66 |
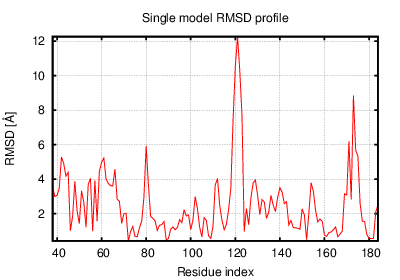
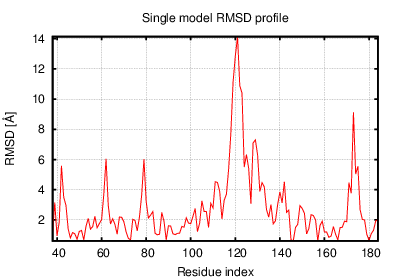
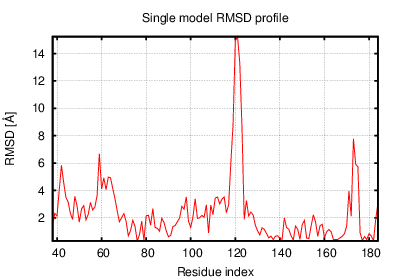
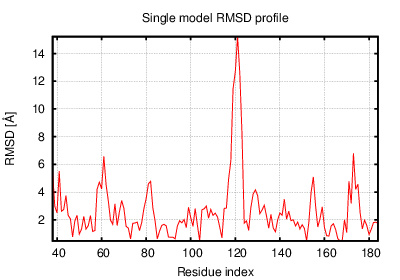
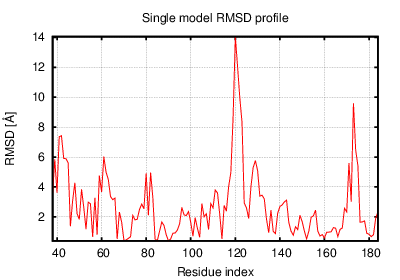
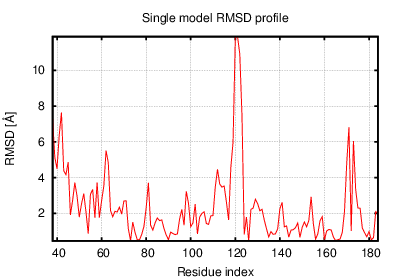
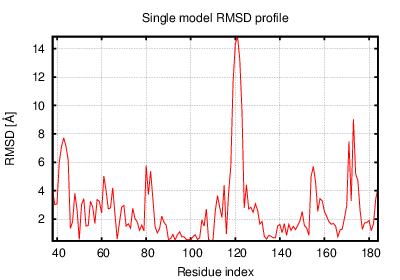
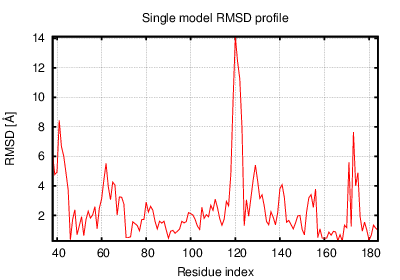
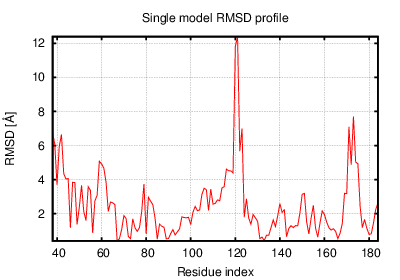
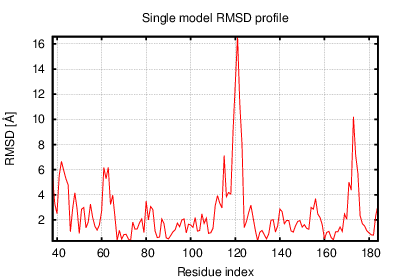
The table contains RMSD and GDT_TS values (calculated on the Cα atoms) between the predicted models and the input structure. Note that GDT_TS metric is intended as a more accurate measurement than the more common RMSD.
Read more about the root-mean-square deviation (RMSD) measure
Read more about the global distance test (GDT, also written as GDT_TS to represent "total score") measure.
| # | 1 | 2 | 3 | 4 | 5 | 6 | 7 | 8 | 9 | 10 | 11 | 12 |
| 1 | 0.00 | 1.90 | 2.98 | 2.01 | 2.01 | 1.82 | 1.93 | 1.86 | 2.75 | 2.10 | 2.25 | 2.20 |
| 2 | 1.90 | 0.00 | 2.40 | 2.12 | 2.03 | 1.80 | 2.26 | 2.03 | 2.34 | 1.88 | 2.22 | 2.03 |
| 3 | 2.98 | 2.40 | 0.00 | 3.38 | 2.78 | 2.68 | 3.03 | 3.22 | 2.14 | 2.84 | 2.76 | 2.83 |
| 4 | 2.01 | 2.12 | 3.38 | 0.00 | 2.30 | 2.37 | 2.24 | 2.05 | 3.34 | 2.25 | 2.53 | 2.43 |
| 5 | 2.01 | 2.03 | 2.78 | 2.30 | 0.00 | 2.10 | 2.39 | 2.08 | 2.56 | 1.87 | 2.43 | 2.32 |
| 6 | 1.82 | 1.80 | 2.68 | 2.37 | 2.10 | 0.00 | 2.30 | 2.15 | 2.28 | 1.71 | 2.30 | 2.17 |
| 7 | 1.93 | 2.26 | 3.03 | 2.24 | 2.39 | 2.30 | 0.00 | 2.02 | 2.67 | 2.25 | 2.25 | 2.03 |
| 8 | 1.86 | 2.03 | 3.22 | 2.05 | 2.08 | 2.15 | 2.02 | 0.00 | 2.88 | 2.15 | 2.54 | 2.10 |
| 9 | 2.75 | 2.34 | 2.14 | 3.34 | 2.56 | 2.28 | 2.67 | 2.88 | 0.00 | 2.39 | 2.59 | 2.48 |
| 10 | 2.10 | 1.88 | 2.84 | 2.25 | 1.87 | 1.71 | 2.25 | 2.15 | 2.39 | 0.00 | 2.43 | 2.37 |
| 11 | 2.25 | 2.22 | 2.76 | 2.53 | 2.43 | 2.30 | 2.25 | 2.54 | 2.59 | 2.43 | 0.00 | 2.29 |
| 12 | 2.20 | 2.03 | 2.83 | 2.43 | 2.32 | 2.17 | 2.03 | 2.10 | 2.48 | 2.37 | 2.29 | 0.00 |
The table contains RMSD values (calculated on the Cα atoms) between the predicted models.
Read more about the root-mean-square deviation (RMSD) measure.
| # | 1 | 2 | 3 | 4 | 5 | 6 | 7 | 8 | 9 | 10 | 11 | 12 |
| 1 | 1.00 | 0.78 | 0.66 | 0.76 | 0.76 | 0.76 | 0.79 | 0.82 | 0.69 | 0.73 | 0.74 | 0.73 |
| 2 | 0.78 | 1.00 | 0.72 | 0.75 | 0.75 | 0.80 | 0.74 | 0.77 | 0.73 | 0.78 | 0.74 | 0.76 |
| 3 | 0.66 | 0.72 | 1.00 | 0.66 | 0.71 | 0.74 | 0.64 | 0.67 | 0.77 | 0.73 | 0.69 | 0.69 |
| 4 | 0.76 | 0.75 | 0.66 | 1.00 | 0.71 | 0.74 | 0.76 | 0.76 | 0.64 | 0.72 | 0.74 | 0.75 |
| 5 | 0.76 | 0.75 | 0.71 | 0.71 | 1.00 | 0.77 | 0.71 | 0.79 | 0.70 | 0.78 | 0.72 | 0.73 |
| 6 | 0.76 | 0.80 | 0.74 | 0.74 | 0.77 | 1.00 | 0.71 | 0.74 | 0.74 | 0.82 | 0.73 | 0.76 |
| 7 | 0.79 | 0.74 | 0.64 | 0.76 | 0.71 | 0.71 | 1.00 | 0.75 | 0.68 | 0.73 | 0.77 | 0.76 |
| 8 | 0.82 | 0.77 | 0.67 | 0.76 | 0.79 | 0.74 | 0.75 | 1.00 | 0.67 | 0.76 | 0.74 | 0.75 |
| 9 | 0.69 | 0.73 | 0.77 | 0.64 | 0.70 | 0.74 | 0.68 | 0.67 | 1.00 | 0.77 | 0.71 | 0.71 |
| 10 | 0.73 | 0.78 | 0.73 | 0.72 | 0.78 | 0.82 | 0.73 | 0.76 | 0.77 | 1.00 | 0.71 | 0.73 |
| 11 | 0.74 | 0.74 | 0.69 | 0.74 | 0.72 | 0.73 | 0.77 | 0.74 | 0.71 | 0.71 | 1.00 | 0.76 |
| 12 | 0.73 | 0.76 | 0.69 | 0.75 | 0.73 | 0.76 | 0.76 | 0.75 | 0.71 | 0.73 | 0.76 | 1.00 |
The table contains GDT_TS values (calculated on the Cα atoms) between the predicted models.
Read more about the global distance test (GDT, also written as GDT_TS to represent "total score") measure.
© Laboratory of Theory of Biopolymers, Faculty of Chemistry, University of Warsaw 2013