Status: Done started: 2018-Dec-11 09:35:16 UTC
| Project Name | |
| Sequence | MCTLKTYKMT TSTEISKNLS DVLSIKATGD WCSNIKTVFS PFTEGKGNLP NSLPFTRSPN TTCGSREAAN ATEHFITVFA KDKYKRKRVK RTIGFTLDNT KELTPNRYLV ADVYSWQEEK MVFEGFCVPP GKSGTFVRYS NEDKSFLLAD TGRYMKKKYD DPENKTSSGG DDDDDDDDDD DDNNNVDVYE ENDPRNVFEV EKDEKYACTF SILVYRAMKK SPPVCRGLLV ETDGPSSHPK RAPSAFNPFG GSSMLNGYGA GADALEEEDE VDGVPERERI TNFALKRGPA TGQNFVSVKL EHDGSKADLY NVTCFSKQRG V |
| Secondary structure | CCCCCCCCCC CCCCCCCCCC CCCCCCCCEE EEEEECCCCC CEECCCCCEE CCCCEEEEEE ECCCCCCCCC CCCCCCCCCC CCCCCCCCCC CCCCCCCCCC CCCCCCCCCC CCCCEEEEEE CCCCCCCCCC CCCCCCCCCC CCEECCCCCC CCCCCCCCCC CCCCCCCCCC CCCCEECCCE EEEEEECCCC CCCCCCCCCE EEEEEEECCC CCCCCCCCCC CCCCCCEEEE CCCCCCHHHH HCCCCCCCCC CCCCCCCCCC CCCCCCCCCC CCCCCCCCCC CCCCCCCCCE EECCCCCCCC CCCCEEEEEE EECCCCCCCC C |
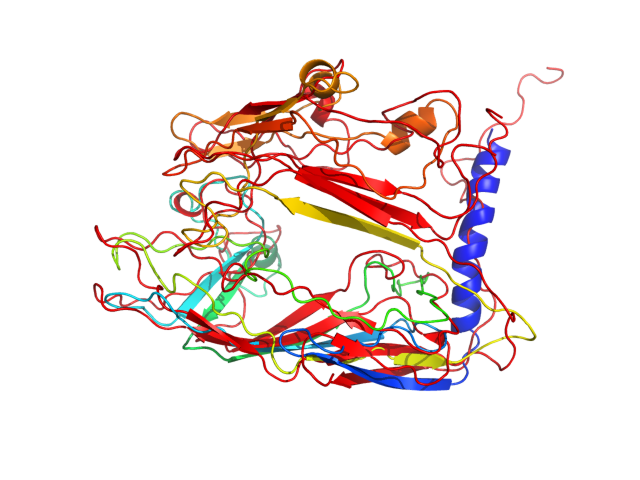
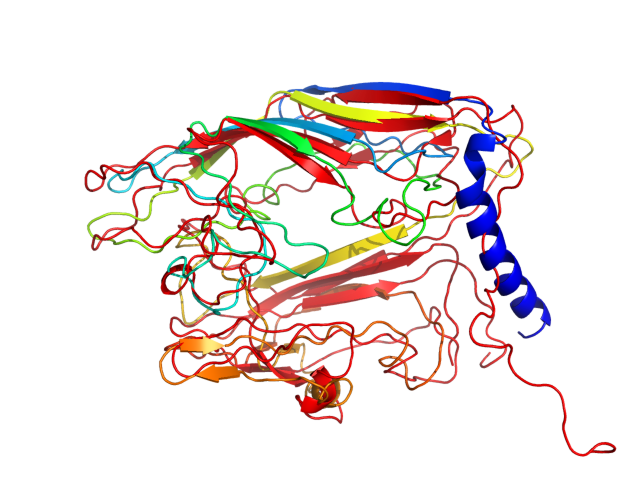
| Movie from predicted structures | To download the movie, right click on the desired file format:  
|
| Estimated finish time | 2018-Dec-11 13:36 UTC |
| Project Name |


| Project Name |
| Cluster # | 1 | 2 | 3 | 4 | 5 | 6 | 7 | 8 | 9 | 10 | 11 | 12 |
| Cluster density | 125.3 | 117.7 | 105.2 | 90.6 | 88.6 | 77.4 | 73.7 | 68.0 | 61.7 | 54.9 | 50.4 | 34.5 |
| Cluster size | 270 | 257 | 223 | 191 | 187 | 175 | 150 | 126 | 128 | 119 | 96 | 78 |
| Average cluster RMSD | 2.2 | 2.2 | 2.1 | 2.1 | 2.1 | 2.3 | 2.0 | 1.9 | 2.1 | 2.2 | 1.9 | 2.3 |
| # | 1 | 2 | 3 | 4 | 5 | 6 | 7 | 8 | 9 | 10 | 11 | 12 |
| RMSD | 7.17 | 6.80 | 7.08 | 6.47 | 6.27 | 6.90 | 6.82 | 6.82 | 5.64 | 5.89 | 6.66 | 5.42 |
| GDT_TS | 0.36 | 0.34 | 0.35 | 0.36 | 0.39 | 0.38 | 0.40 | 0.33 | 0.42 | 0.40 | 0.38 | 0.43 |
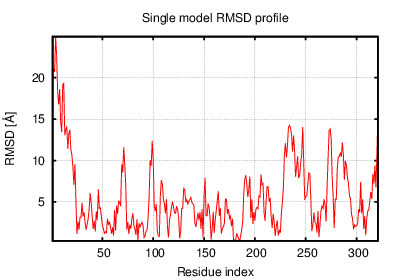
The table contains RMSD and GDT_TS values (calculated on the Cα atoms) between the predicted models and the input structure. Note that GDT_TS metric is intended as a more accurate measurement than the more common RMSD.
Read more about the root-mean-square deviation (RMSD) measure
Read more about the global distance test (GDT, also written as GDT_TS to represent "total score") measure.
| # | 1 | 2 | 3 | 4 | 5 | 6 | 7 | 8 | 9 | 10 | 11 | 12 |
| 1 | 0.00 | 3.47 | 2.95 | 3.95 | 4.40 | 3.82 | 4.32 | 3.01 | 5.14 | 5.29 | 4.21 | 5.93 |
| 2 | 3.47 | 0.00 | 2.99 | 4.39 | 4.16 | 3.49 | 4.31 | 3.47 | 4.69 | 5.26 | 4.59 | 5.73 |
| 3 | 2.95 | 2.99 | 0.00 | 4.19 | 4.30 | 3.77 | 4.21 | 3.03 | 4.84 | 5.43 | 4.02 | 6.01 |
| 4 | 3.95 | 4.39 | 4.19 | 0.00 | 4.62 | 4.32 | 4.06 | 3.79 | 4.18 | 5.11 | 3.51 | 5.76 |
| 5 | 4.40 | 4.16 | 4.30 | 4.62 | 0.00 | 3.82 | 4.04 | 4.10 | 3.41 | 4.10 | 5.11 | 5.25 |
| 6 | 3.82 | 3.49 | 3.77 | 4.32 | 3.82 | 0.00 | 4.17 | 3.69 | 4.11 | 5.01 | 4.18 | 5.80 |
| 7 | 4.32 | 4.31 | 4.21 | 4.06 | 4.04 | 4.17 | 0.00 | 4.29 | 4.07 | 4.82 | 3.58 | 5.90 |
| 8 | 3.01 | 3.47 | 3.03 | 3.79 | 4.10 | 3.69 | 4.29 | 0.00 | 4.80 | 5.37 | 4.03 | 6.22 |
| 9 | 5.14 | 4.69 | 4.84 | 4.18 | 3.41 | 4.11 | 4.07 | 4.80 | 0.00 | 3.65 | 4.54 | 4.64 |
| 10 | 5.29 | 5.26 | 5.43 | 5.11 | 4.10 | 5.01 | 4.82 | 5.37 | 3.65 | 0.00 | 5.46 | 4.22 |
| 11 | 4.21 | 4.59 | 4.02 | 3.51 | 5.11 | 4.18 | 3.58 | 4.03 | 4.54 | 5.46 | 0.00 | 5.89 |
| 12 | 5.93 | 5.73 | 6.01 | 5.76 | 5.25 | 5.80 | 5.90 | 6.22 | 4.64 | 4.22 | 5.89 | 0.00 |
The table contains RMSD values (calculated on the Cα atoms) between the predicted models.
Read more about the root-mean-square deviation (RMSD) measure.
| # | 1 | 2 | 3 | 4 | 5 | 6 | 7 | 8 | 9 | 10 | 11 | 12 |
| 1 | 1.00 | 0.57 | 0.61 | 0.58 | 0.53 | 0.55 | 0.49 | 0.64 | 0.45 | 0.42 | 0.51 | 0.38 |
| 2 | 0.57 | 1.00 | 0.63 | 0.49 | 0.49 | 0.57 | 0.46 | 0.58 | 0.44 | 0.40 | 0.46 | 0.41 |
| 3 | 0.61 | 0.63 | 1.00 | 0.54 | 0.51 | 0.54 | 0.45 | 0.63 | 0.45 | 0.40 | 0.48 | 0.38 |
| 4 | 0.58 | 0.49 | 0.54 | 1.00 | 0.49 | 0.49 | 0.52 | 0.54 | 0.49 | 0.43 | 0.59 | 0.39 |
| 5 | 0.53 | 0.49 | 0.51 | 0.49 | 1.00 | 0.55 | 0.50 | 0.53 | 0.58 | 0.49 | 0.45 | 0.45 |
| 6 | 0.55 | 0.57 | 0.54 | 0.49 | 0.55 | 1.00 | 0.46 | 0.56 | 0.49 | 0.41 | 0.50 | 0.39 |
| 7 | 0.49 | 0.46 | 0.45 | 0.52 | 0.50 | 0.46 | 1.00 | 0.48 | 0.51 | 0.46 | 0.56 | 0.44 |
| 8 | 0.64 | 0.58 | 0.63 | 0.54 | 0.53 | 0.56 | 0.48 | 1.00 | 0.46 | 0.40 | 0.50 | 0.37 |
| 9 | 0.45 | 0.44 | 0.45 | 0.49 | 0.58 | 0.49 | 0.51 | 0.46 | 1.00 | 0.55 | 0.47 | 0.48 |
| 10 | 0.42 | 0.40 | 0.40 | 0.43 | 0.49 | 0.41 | 0.46 | 0.40 | 0.55 | 1.00 | 0.41 | 0.53 |
| 11 | 0.51 | 0.46 | 0.48 | 0.59 | 0.45 | 0.50 | 0.56 | 0.50 | 0.47 | 0.41 | 1.00 | 0.41 |
| 12 | 0.38 | 0.41 | 0.38 | 0.39 | 0.45 | 0.39 | 0.44 | 0.37 | 0.48 | 0.53 | 0.41 | 1.00 |
The table contains GDT_TS values (calculated on the Cα atoms) between the predicted models.
Read more about the global distance test (GDT, also written as GDT_TS to represent "total score") measure.
© Laboratory of Theory of Biopolymers, Faculty of Chemistry, University of Warsaw 2013