Status: Done started: 2018-Nov-28 22:40:55 UTC
| Project Name | |
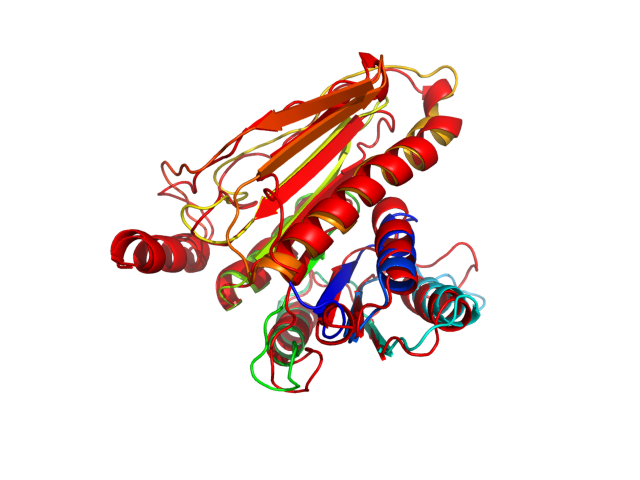
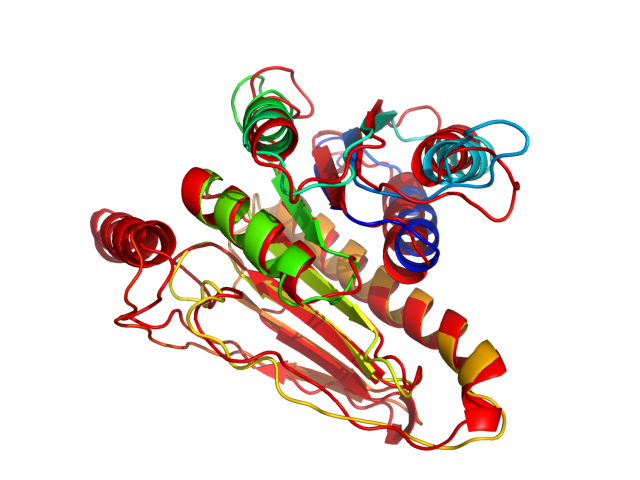
| Sequence | EKIRTFAVAI VGVGGVGSVT AEMLTRCGIG KLLLFDYDKV HQAGLSKVQA AEHTLRNINP DVLFEVHNYN ITTVENFQHF MDRISNGGLE EGKPVDLVLS CVDNFEARMT INTACNELGQ TWMESGVSEN AVSGHIQLII PGESACFACA PPLVVAANRE GVCAASLPTT MGVVAGILVQ NVLKFLLNFG TVSFYLGYNA MQDFFPTMSM KPNPQCDDRN CRKQQEEYKK K |
| Secondary structure | CCCCCCEEEE ECCCHHHHHH HHHHHHHCCC EEEEECCCCC CCCCCCHHHH HHHHHHHHCC CCEEEEECCC CCCHHHHHHH HHHHHHCCCC CCCCCCEEEE CCCCHHHHHH HHHHHHHHCC CEEEEEECCC CCEEEEEEEC CCCCCCCCCC CCCCCCCCCC CHHHHHHHHH HHHHHHHHHH HHHHHHCCCC CCCCEEEEEC CCCCCCEECC CCCCCCCCHH HHHHHHHHHH C |
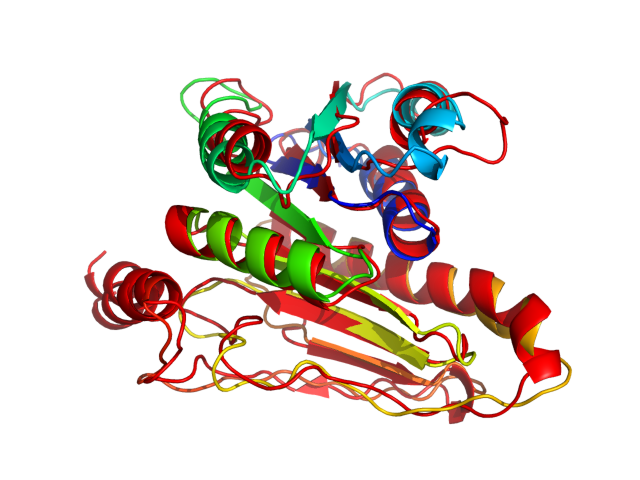
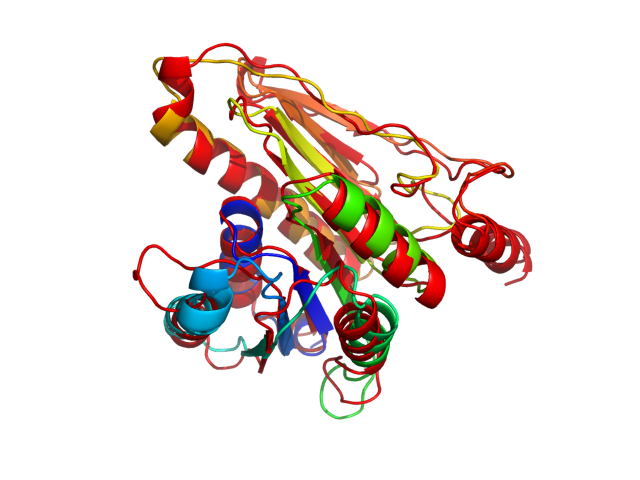
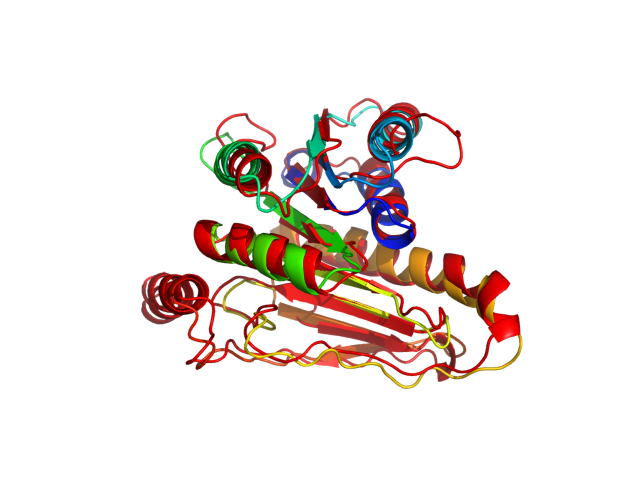
| Movie from predicted structures | To download the movie, right click on the desired file format:  
|
| Estimated finish time | 2018-Nov-29 02:30 UTC |
| Project Name |

| Project Name |
| Cluster # | 1 | 2 | 3 | 4 | 5 | 6 | 7 | 8 | 9 | 10 | 11 | 12 |
| Cluster density | 291.3 | 191.4 | 176.8 | 166.8 | 166.0 | 154.6 | 141.3 | 135.6 | 88.3 | 72.7 | 47.0 | 43.7 |
| Cluster size | 347 | 233 | 216 | 208 | 211 | 172 | 152 | 164 | 123 | 85 | 44 | 45 |
| Average cluster RMSD | 1.2 | 1.2 | 1.2 | 1.2 | 1.3 | 1.1 | 1.1 | 1.2 | 1.4 | 1.2 | 0.9 | 1.0 |
| # | 1 | 2 | 3 | 4 | 5 | 6 | 7 | 8 | 9 | 10 | 11 | 12 |
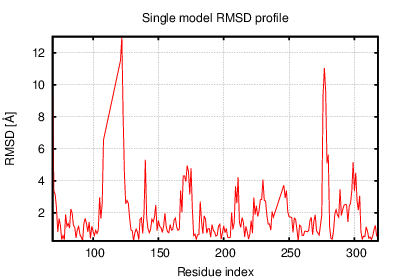
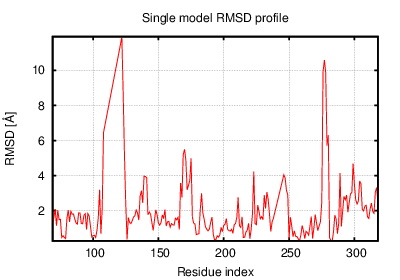
| RMSD | 2.47 | 2.76 | 2.65 | 2.65 | 2.67 | 2.69 | 2.83 | 2.96 | 2.55 | 2.53 | 2.43 | 2.61 |
| GDT_TS | 0.75 | 0.69 | 0.72 | 0.76 | 0.73 | 0.71 | 0.71 | 0.68 | 0.76 | 0.76 | 0.76 | 0.73 |
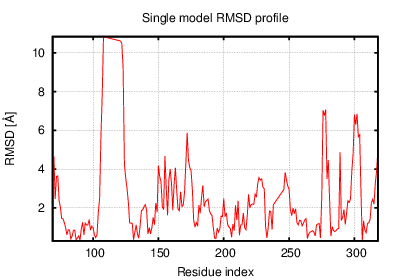
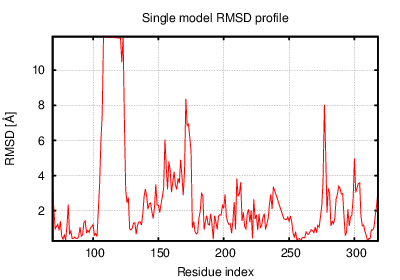
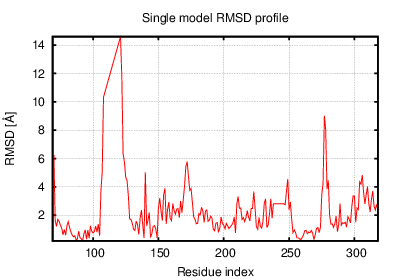
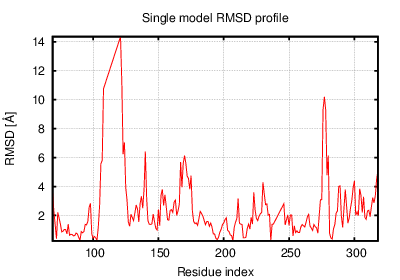
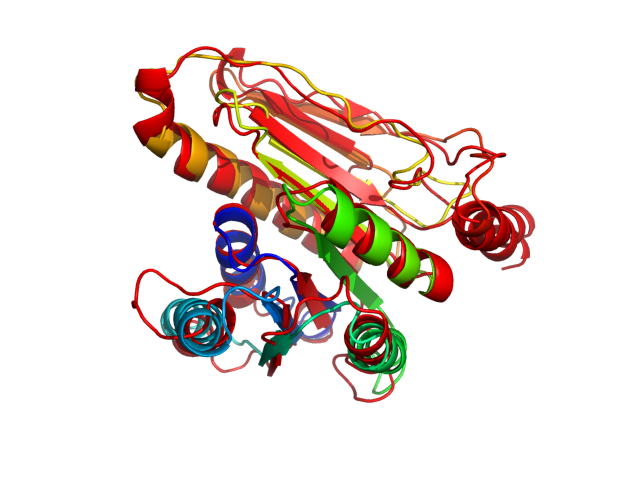
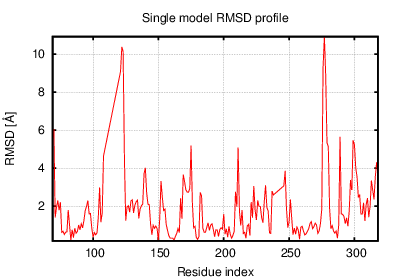
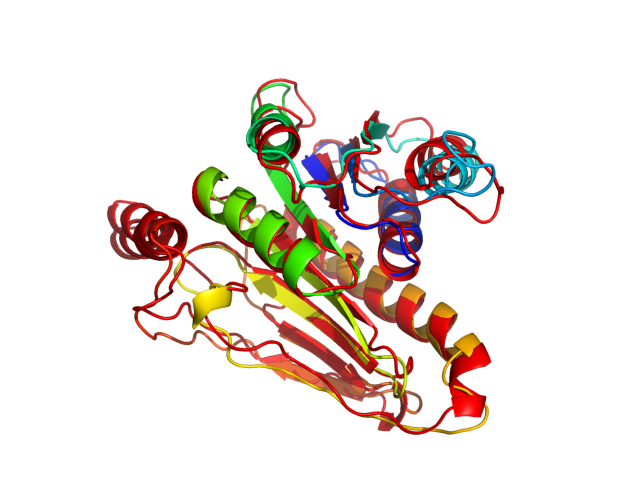
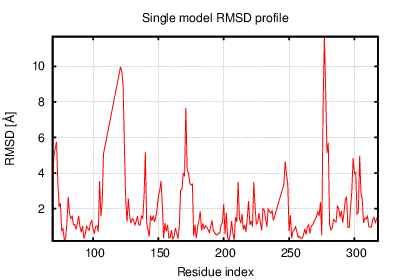
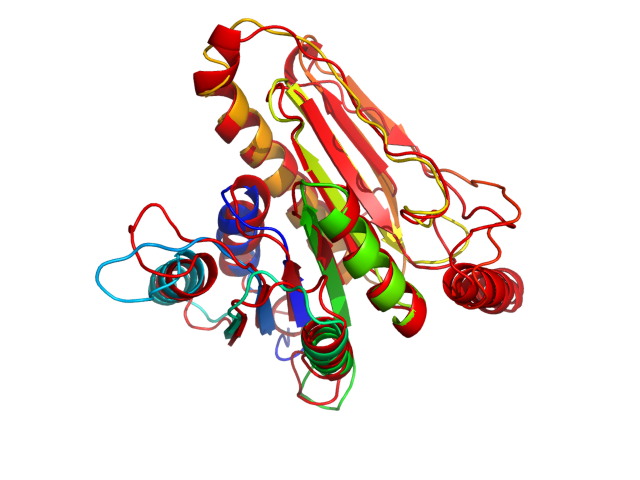
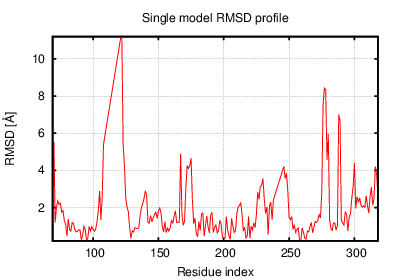
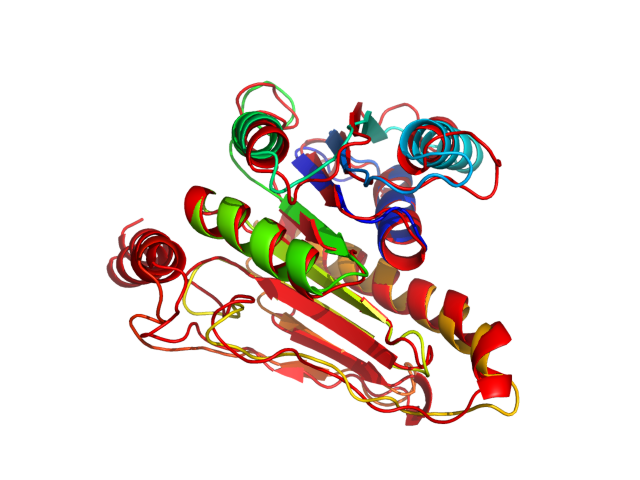
The table contains RMSD and GDT_TS values (calculated on the Cα atoms) between the predicted models and the input structure. Note that GDT_TS metric is intended as a more accurate measurement than the more common RMSD.
Read more about the root-mean-square deviation (RMSD) measure
Read more about the global distance test (GDT, also written as GDT_TS to represent "total score") measure.
| # | 1 | 2 | 3 | 4 | 5 | 6 | 7 | 8 | 9 | 10 | 11 | 12 |
| 1 | 0.00 | 1.92 | 1.88 | 2.53 | 2.33 | 1.82 | 2.32 | 2.31 | 2.19 | 2.28 | 2.32 | 2.03 |
| 2 | 1.92 | 0.00 | 1.75 | 2.76 | 2.54 | 2.20 | 2.29 | 2.21 | 2.26 | 2.74 | 2.30 | 1.87 |
| 3 | 1.88 | 1.75 | 0.00 | 2.76 | 2.43 | 2.29 | 2.30 | 2.16 | 2.40 | 2.54 | 2.33 | 2.05 |
| 4 | 2.53 | 2.76 | 2.76 | 0.00 | 1.82 | 2.49 | 2.50 | 2.41 | 1.98 | 1.99 | 2.02 | 2.44 |
| 5 | 2.33 | 2.54 | 2.43 | 1.82 | 0.00 | 2.33 | 2.09 | 1.99 | 1.48 | 1.93 | 1.69 | 2.11 |
| 6 | 1.82 | 2.20 | 2.29 | 2.49 | 2.33 | 0.00 | 2.43 | 2.44 | 2.25 | 2.28 | 2.34 | 2.19 |
| 7 | 2.32 | 2.29 | 2.30 | 2.50 | 2.09 | 2.43 | 0.00 | 1.78 | 2.24 | 2.60 | 2.48 | 2.02 |
| 8 | 2.31 | 2.21 | 2.16 | 2.41 | 1.99 | 2.44 | 1.78 | 0.00 | 2.12 | 2.58 | 2.29 | 1.85 |
| 9 | 2.19 | 2.26 | 2.40 | 1.98 | 1.48 | 2.25 | 2.24 | 2.12 | 0.00 | 2.09 | 1.75 | 2.03 |
| 10 | 2.28 | 2.74 | 2.54 | 1.99 | 1.93 | 2.28 | 2.60 | 2.58 | 2.09 | 0.00 | 2.14 | 2.45 |
| 11 | 2.32 | 2.30 | 2.33 | 2.02 | 1.69 | 2.34 | 2.48 | 2.29 | 1.75 | 2.14 | 0.00 | 1.88 |
| 12 | 2.03 | 1.87 | 2.05 | 2.44 | 2.11 | 2.19 | 2.02 | 1.85 | 2.03 | 2.45 | 1.88 | 0.00 |
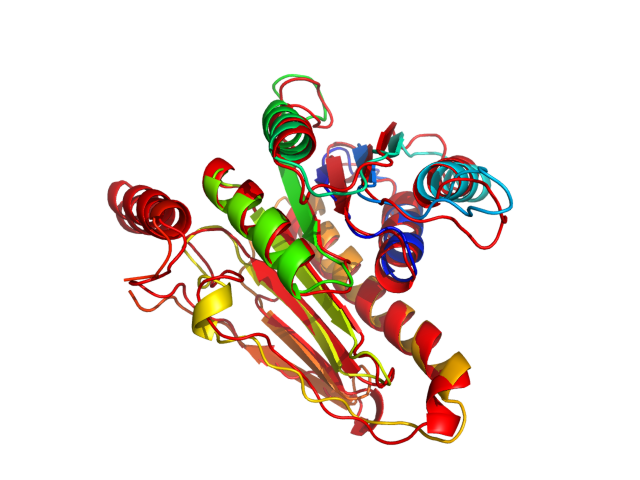
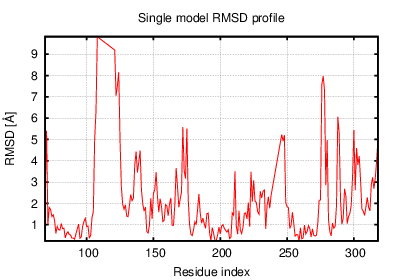
The table contains RMSD values (calculated on the Cα atoms) between the predicted models.
Read more about the root-mean-square deviation (RMSD) measure.
| # | 1 | 2 | 3 | 4 | 5 | 6 | 7 | 8 | 9 | 10 | 11 | 12 |
| 1 | 1.00 | 0.77 | 0.80 | 0.72 | 0.71 | 0.78 | 0.73 | 0.71 | 0.72 | 0.76 | 0.73 | 0.76 |
| 2 | 0.77 | 1.00 | 0.80 | 0.68 | 0.69 | 0.75 | 0.74 | 0.75 | 0.72 | 0.68 | 0.72 | 0.77 |
| 3 | 0.80 | 0.80 | 1.00 | 0.68 | 0.73 | 0.76 | 0.73 | 0.73 | 0.71 | 0.70 | 0.75 | 0.76 |
| 4 | 0.72 | 0.68 | 0.68 | 1.00 | 0.79 | 0.69 | 0.73 | 0.75 | 0.80 | 0.79 | 0.78 | 0.75 |
| 5 | 0.71 | 0.69 | 0.73 | 0.79 | 1.00 | 0.72 | 0.77 | 0.78 | 0.84 | 0.76 | 0.84 | 0.76 |
| 6 | 0.78 | 0.75 | 0.76 | 0.69 | 0.72 | 1.00 | 0.71 | 0.71 | 0.72 | 0.71 | 0.71 | 0.74 |
| 7 | 0.73 | 0.74 | 0.73 | 0.73 | 0.77 | 0.71 | 1.00 | 0.80 | 0.76 | 0.71 | 0.72 | 0.78 |
| 8 | 0.71 | 0.75 | 0.73 | 0.75 | 0.78 | 0.71 | 0.80 | 1.00 | 0.77 | 0.70 | 0.73 | 0.79 |
| 9 | 0.72 | 0.72 | 0.71 | 0.80 | 0.84 | 0.72 | 0.76 | 0.77 | 1.00 | 0.76 | 0.81 | 0.77 |
| 10 | 0.76 | 0.68 | 0.70 | 0.79 | 0.76 | 0.71 | 0.71 | 0.70 | 0.76 | 1.00 | 0.76 | 0.75 |
| 11 | 0.73 | 0.72 | 0.75 | 0.78 | 0.84 | 0.71 | 0.72 | 0.73 | 0.81 | 0.76 | 1.00 | 0.80 |
| 12 | 0.76 | 0.77 | 0.76 | 0.75 | 0.76 | 0.74 | 0.78 | 0.79 | 0.77 | 0.75 | 0.80 | 1.00 |
The table contains GDT_TS values (calculated on the Cα atoms) between the predicted models.
Read more about the global distance test (GDT, also written as GDT_TS to represent "total score") measure.
© Laboratory of Theory of Biopolymers, Faculty of Chemistry, University of Warsaw 2013