Status: Done started: 2018-Mar-14 18:20:42 UTC
| Project Name | 198 |
| Sequence | CGVFGCIASG EWPTQLDVPH VITLGLVGLQ HRGQESAGIV TSDGSSVPTF KSHKGMGLVN HVFTEDNLKK LYVSNLGIGH TRYATTGKCE LENCQPFVVE TLHGKIAVAH NGELVNAARL RKKLLRHGIG LSTSSDSEMI TQLLAYTPPQ EQDDTPDWVA RIKNLMKEAP TAYSLLIMHR DVIYAVQDPY GNRPLCIGRL IPVSDINDKE KKTSETEGWV VSSESCSFLS IGARYYREVL PGEIVEISRH NVQTLDIISR SEGNPVAFCI FEYVYFARPD SMFE |
| Secondary structure | CEEEEEECCC CCCCCCHHHH HHHHCCCCCC CCCCCEEEEE EEECCCCCEE EEEEEECCHH HHCCHHHHHH HCCCCCEEEE EECCCCCCCC CCCCCCEEEE ECCEEEEEEE ECCCCCHHHH HHHCCCCCCC CCCCCHHHHH HHHHHHCCCC CCCHHHHHHH HHHHHCCCCC EEEEEECCCC CCCEEECCCC CCCCCEEEEE CCCCCCCHHH HCCCCCCCEE EECCHHHHHH HCEEEEEECC CCCEEEECCC CCCCCCEEEE CCCCCCCCCC CCCCCCCCCC CCCC |
| Movie from predicted structures | To download the movie, right click on the desired file format:  
|
| Estimated finish time | 2018-Mar-14 22:17 UTC |
| Project Name | 198 |

| Project Name | 198 |
| Cluster # | 1 | 2 | 3 | 4 | 5 | 6 | 7 | 8 | 9 | 10 | 11 | 12 |
| Cluster density | 219.5 | 152.7 | 148.3 | 140.9 | 138.9 | 136.0 | 126.8 | 125.7 | 124.7 | 103.0 | 87.8 | 85.6 |
| Cluster size | 304 | 187 | 181 | 175 | 172 | 174 | 160 | 161 | 149 | 133 | 102 | 102 |
| Average cluster RMSD | 1.4 | 1.2 | 1.2 | 1.2 | 1.2 | 1.3 | 1.3 | 1.3 | 1.2 | 1.3 | 1.2 | 1.2 |
| # | 1 | 2 | 3 | 4 | 5 | 6 | 7 | 8 | 9 | 10 | 11 | 12 |
| RMSD | 3.05 | 2.72 | 2.88 | 2.45 | 2.63 | 2.83 | 2.61 | 2.61 | 2.63 | 2.99 | 2.70 | 2.51 |
| GDT_TS | 0.68 | 0.67 | 0.68 | 0.68 | 0.68 | 0.67 | 0.70 | 0.68 | 0.68 | 0.65 | 0.68 | 0.70 |
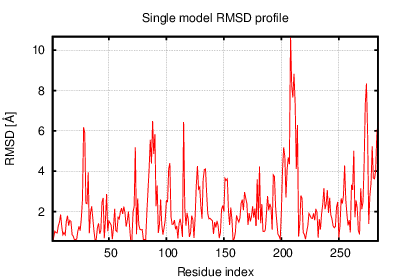
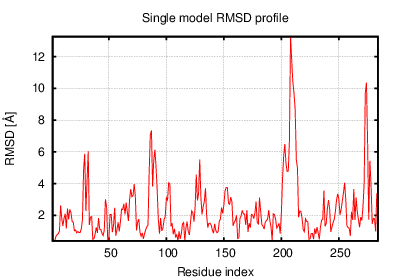
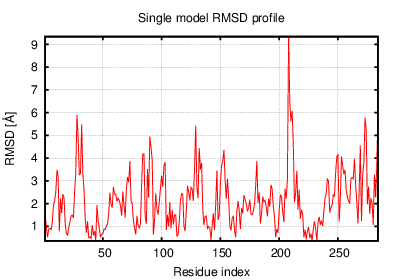
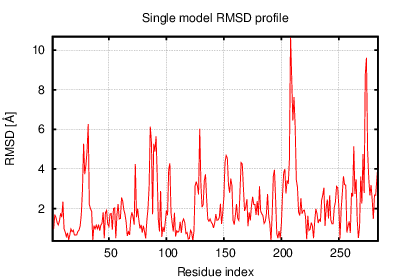
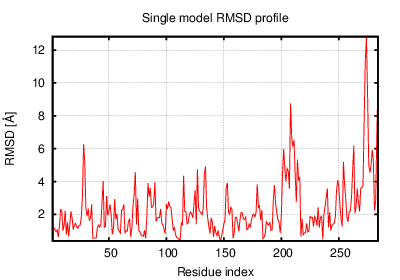
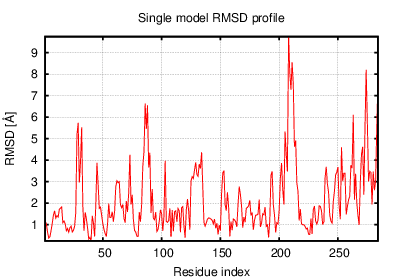
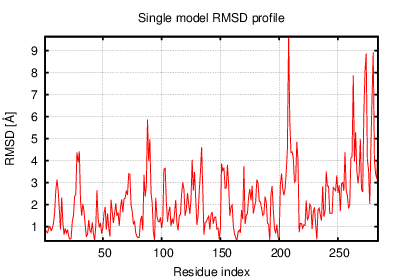
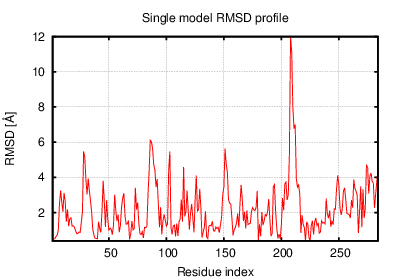
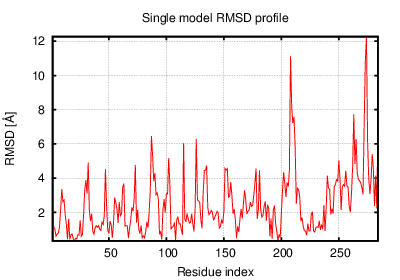
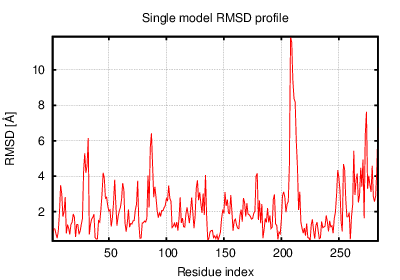
The table contains RMSD and GDT_TS values (calculated on the Cα atoms) between the predicted models and the input structure. Note that GDT_TS metric is intended as a more accurate measurement than the more common RMSD.
Read more about the root-mean-square deviation (RMSD) measure
Read more about the global distance test (GDT, also written as GDT_TS to represent "total score") measure.
| # | 1 | 2 | 3 | 4 | 5 | 6 | 7 | 8 | 9 | 10 | 11 | 12 |
| 1 | 0.00 | 2.10 | 2.27 | 2.48 | 2.32 | 2.43 | 2.43 | 2.48 | 2.43 | 2.44 | 2.48 | 2.65 |
| 2 | 2.10 | 0.00 | 2.01 | 2.09 | 1.79 | 2.02 | 1.87 | 2.07 | 1.99 | 2.14 | 2.15 | 2.04 |
| 3 | 2.27 | 2.01 | 0.00 | 2.12 | 1.61 | 2.41 | 1.95 | 2.21 | 1.92 | 2.18 | 2.43 | 2.34 |
| 4 | 2.48 | 2.09 | 2.12 | 0.00 | 1.96 | 2.41 | 2.02 | 2.15 | 2.00 | 2.38 | 2.38 | 2.01 |
| 5 | 2.32 | 1.79 | 1.61 | 1.96 | 0.00 | 2.26 | 1.80 | 2.03 | 1.92 | 2.17 | 2.40 | 2.21 |
| 6 | 2.43 | 2.02 | 2.41 | 2.41 | 2.26 | 0.00 | 2.02 | 2.16 | 2.32 | 2.09 | 2.28 | 2.34 |
| 7 | 2.43 | 1.87 | 1.95 | 2.02 | 1.80 | 2.02 | 0.00 | 2.18 | 1.83 | 2.22 | 2.19 | 2.19 |
| 8 | 2.48 | 2.07 | 2.21 | 2.15 | 2.03 | 2.16 | 2.18 | 0.00 | 2.16 | 1.96 | 2.49 | 1.99 |
| 9 | 2.43 | 1.99 | 1.92 | 2.00 | 1.92 | 2.32 | 1.83 | 2.16 | 0.00 | 2.17 | 2.12 | 2.05 |
| 10 | 2.44 | 2.14 | 2.18 | 2.38 | 2.17 | 2.09 | 2.22 | 1.96 | 2.17 | 0.00 | 2.42 | 2.27 |
| 11 | 2.48 | 2.15 | 2.43 | 2.38 | 2.40 | 2.28 | 2.19 | 2.49 | 2.12 | 2.42 | 0.00 | 2.30 |
| 12 | 2.65 | 2.04 | 2.34 | 2.01 | 2.21 | 2.34 | 2.19 | 1.99 | 2.05 | 2.27 | 2.30 | 0.00 |
The table contains RMSD values (calculated on the Cα atoms) between the predicted models.
Read more about the root-mean-square deviation (RMSD) measure.
| # | 1 | 2 | 3 | 4 | 5 | 6 | 7 | 8 | 9 | 10 | 11 | 12 |
| 1 | 1.00 | 0.75 | 0.75 | 0.71 | 0.75 | 0.71 | 0.74 | 0.71 | 0.76 | 0.71 | 0.72 | 0.74 |
| 2 | 0.75 | 1.00 | 0.75 | 0.75 | 0.80 | 0.76 | 0.78 | 0.74 | 0.76 | 0.74 | 0.73 | 0.78 |
| 3 | 0.75 | 0.75 | 1.00 | 0.76 | 0.81 | 0.73 | 0.79 | 0.77 | 0.76 | 0.74 | 0.70 | 0.74 |
| 4 | 0.71 | 0.75 | 0.76 | 1.00 | 0.77 | 0.73 | 0.77 | 0.75 | 0.76 | 0.72 | 0.70 | 0.78 |
| 5 | 0.75 | 0.80 | 0.81 | 0.77 | 1.00 | 0.73 | 0.79 | 0.78 | 0.76 | 0.73 | 0.69 | 0.76 |
| 6 | 0.71 | 0.76 | 0.73 | 0.73 | 0.73 | 1.00 | 0.78 | 0.74 | 0.75 | 0.74 | 0.72 | 0.75 |
| 7 | 0.74 | 0.78 | 0.79 | 0.77 | 0.79 | 0.78 | 1.00 | 0.75 | 0.80 | 0.74 | 0.74 | 0.80 |
| 8 | 0.71 | 0.74 | 0.77 | 0.75 | 0.78 | 0.74 | 0.75 | 1.00 | 0.75 | 0.77 | 0.69 | 0.76 |
| 9 | 0.76 | 0.76 | 0.76 | 0.76 | 0.76 | 0.75 | 0.80 | 0.75 | 1.00 | 0.75 | 0.75 | 0.78 |
| 10 | 0.71 | 0.74 | 0.74 | 0.72 | 0.73 | 0.74 | 0.74 | 0.77 | 0.75 | 1.00 | 0.70 | 0.74 |
| 11 | 0.72 | 0.73 | 0.70 | 0.70 | 0.69 | 0.72 | 0.74 | 0.69 | 0.75 | 0.70 | 1.00 | 0.75 |
| 12 | 0.74 | 0.78 | 0.74 | 0.78 | 0.76 | 0.75 | 0.80 | 0.76 | 0.78 | 0.74 | 0.75 | 1.00 |
The table contains GDT_TS values (calculated on the Cα atoms) between the predicted models.
Read more about the global distance test (GDT, also written as GDT_TS to represent "total score") measure.
© Laboratory of Theory of Biopolymers, Faculty of Chemistry, University of Warsaw 2013