Status: Done started: 2018-Nov-18 14:56:27 UTC
| Project Name | |
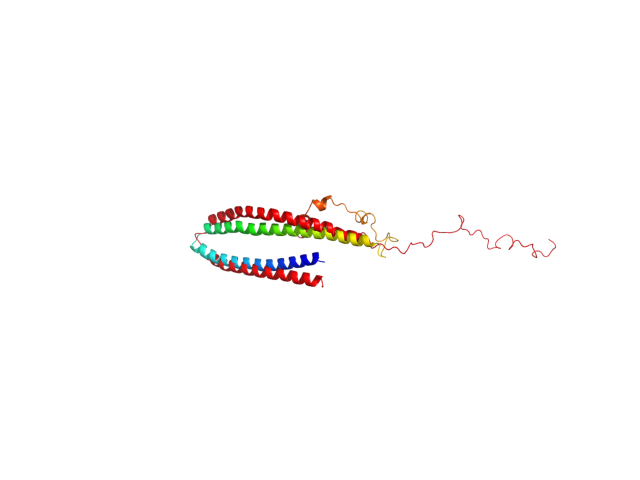
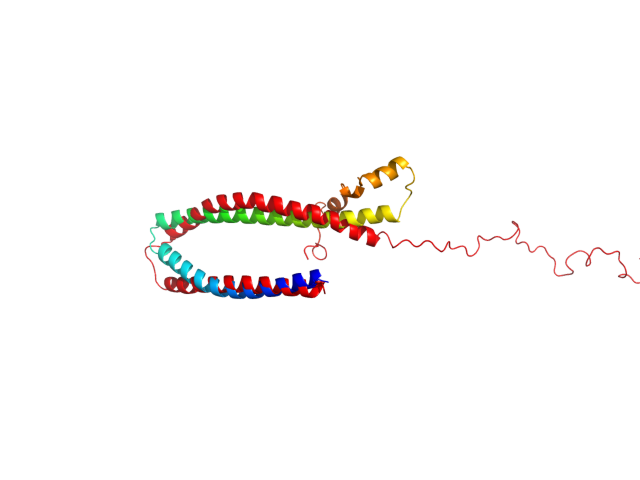
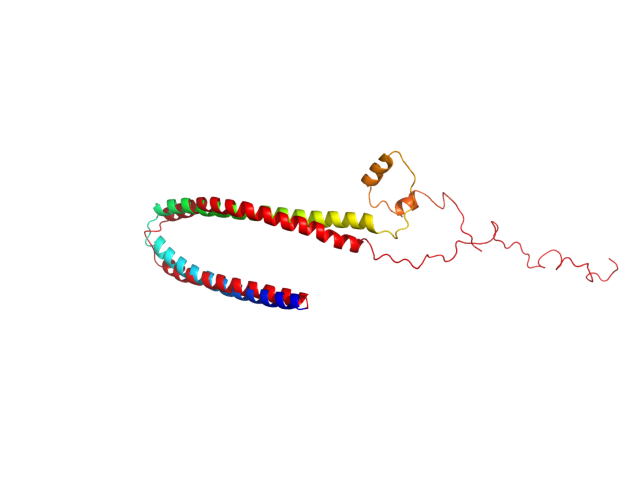
| Sequence | MDVFMKGLSK AKEGVVAAAE KTKQGVAEAA GKTKEGVLYV GSKTKEGVVH GVATVAEKTK EQVTNVGGAV VTGVTAVAQK TVEGAGSIAA ATGFVKKDQL GKNEEGAPQE GILEDMPVDP DNEAYEMPSE EGYQDYEPEA |
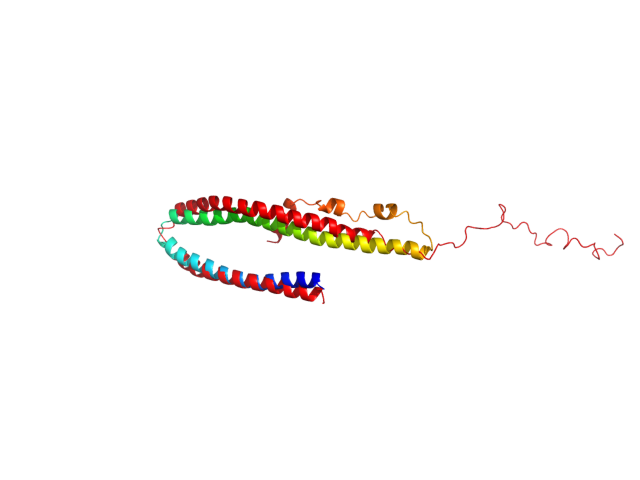
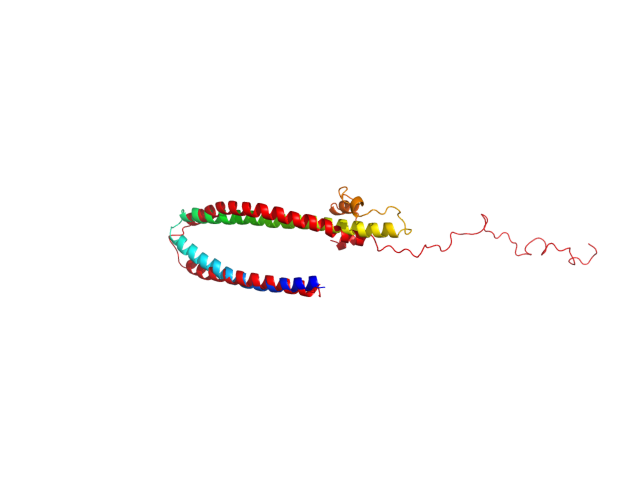
| Secondary structure | CCHHHHHHHH HHHHHHHHHH HHHHHHHHHH HHHHHHHCCC CCCCHHHHHH HHHHHHHHHH HHHHHHHHHH HHHHHHHHHH HHHHHHHHHH HHCCCCCCCC CCCCCCCCCC CCCCCCCCCC CCCCCCCCCC CCCCCCCCCC |
| Movie from predicted structures | To download the movie, right click on the desired file format:  
|
| Estimated finish time | 2018-Nov-18 18:33 UTC |
| Project Name |
| Project Name |
| Cluster # | 1 | 2 | 3 | 4 | 5 | 6 | 7 | 8 | 9 | 10 |
| Cluster density | 185.2 | 99.9 | 85.6 | 77.0 | 41.1 | 36.0 | 21.0 | 17.5 | 13.5 | 12.1 |
| Cluster size | 564 | 485 | 272 | 227 | 120 | 82 | 63 | 81 | 58 | 48 |
| Average cluster RMSD | 3.0 | 4.9 | 3.2 | 2.9 | 2.9 | 2.3 | 3.0 | 4.6 | 4.3 | 4.0 |
| # | 1 | 2 | 3 | 4 | 5 | 6 | 7 | 8 | 9 | 10 |
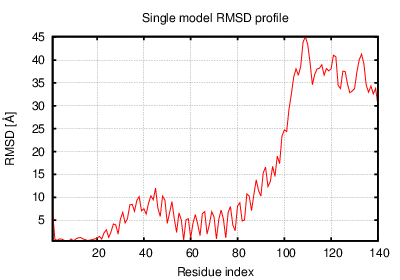
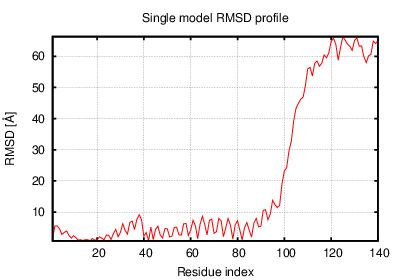
| RMSD | 38.10 | 38.50 | 35.30 | 34.70 | 30.10 | 33.70 | 33.50 | 13.20 | 25.80 | 19.50 |
| GDT_TS | 0.26 | 0.28 | 0.29 | 0.34 | 0.33 | 0.30 | 0.33 | 0.34 | 0.33 | 0.35 |
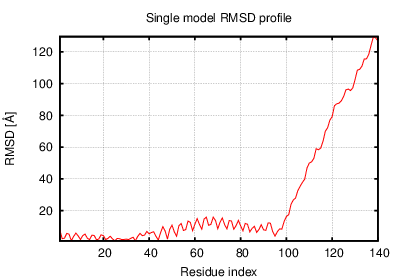
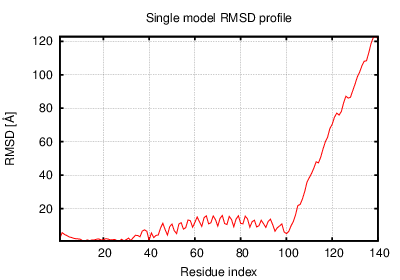
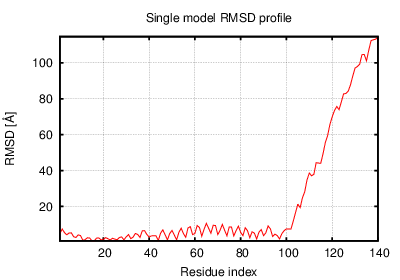
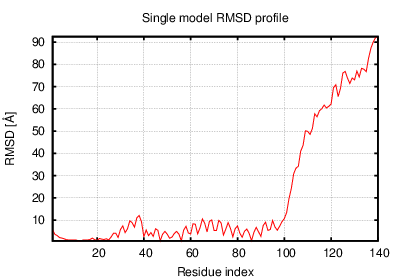
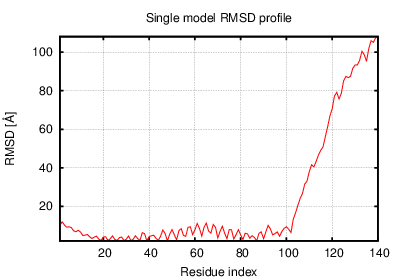
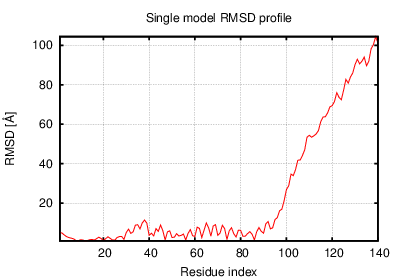
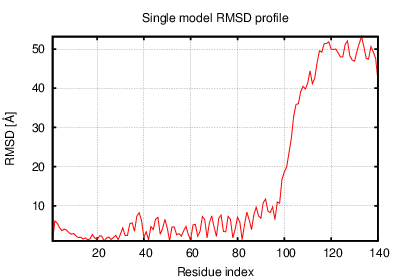
The table contains RMSD and GDT_TS values (calculated on the Cα atoms) between the predicted models and the input structure. Note that GDT_TS metric is intended as a more accurate measurement than the more common RMSD.
Read more about the root-mean-square deviation (RMSD) measure
Read more about the global distance test (GDT, also written as GDT_TS to represent "total score") measure.
| # | 1 | 2 | 3 | 4 | 5 | 6 | 7 | 8 | 9 | 10 |
| 1 | 0.00 | 4.81 | 8.93 | 10.40 | 13.70 | 11.10 | 11.80 | 30.60 | 19.00 | 23.10 |
| 2 | 4.81 | 0.00 | 5.92 | 8.68 | 13.70 | 9.46 | 11.70 | 30.50 | 19.40 | 23.20 |
| 3 | 8.93 | 5.92 | 0.00 | 6.81 | 12.50 | 6.89 | 11.60 | 27.70 | 18.00 | 20.90 |
| 4 | 10.40 | 8.68 | 6.81 | 0.00 | 9.34 | 5.04 | 8.12 | 26.10 | 15.30 | 19.10 |
| 5 | 13.70 | 13.70 | 12.50 | 9.34 | 0.00 | 10.20 | 5.30 | 20.40 | 7.48 | 12.80 |
| 6 | 11.10 | 9.46 | 6.89 | 5.04 | 10.20 | 0.00 | 10.20 | 25.40 | 15.30 | 18.80 |
| 7 | 11.80 | 11.70 | 11.60 | 8.12 | 5.30 | 10.20 | 0.00 | 23.90 | 10.80 | 16.40 |
| 8 | 30.60 | 30.50 | 27.70 | 26.10 | 20.40 | 25.40 | 23.90 | 0.00 | 15.90 | 9.56 |
| 9 | 19.00 | 19.40 | 18.00 | 15.30 | 7.48 | 15.30 | 10.80 | 15.90 | 0.00 | 8.37 |
| 10 | 23.10 | 23.20 | 20.90 | 19.10 | 12.80 | 18.80 | 16.40 | 9.56 | 8.37 | 0.00 |
The table contains RMSD values (calculated on the Cα atoms) between the predicted models.
Read more about the root-mean-square deviation (RMSD) measure.
| # | 1 | 2 | 3 | 4 | 5 | 6 | 7 | 8 | 9 | 10 |
| 1 | 1.00 | 0.56 | 0.44 | 0.38 | 0.37 | 0.41 | 0.35 | 0.33 | 0.34 | 0.35 |
| 2 | 0.56 | 1.00 | 0.52 | 0.43 | 0.47 | 0.47 | 0.41 | 0.36 | 0.42 | 0.39 |
| 3 | 0.44 | 0.52 | 1.00 | 0.57 | 0.47 | 0.65 | 0.46 | 0.38 | 0.43 | 0.43 |
| 4 | 0.38 | 0.43 | 0.57 | 1.00 | 0.50 | 0.57 | 0.47 | 0.39 | 0.45 | 0.46 |
| 5 | 0.37 | 0.47 | 0.47 | 0.50 | 1.00 | 0.46 | 0.65 | 0.48 | 0.57 | 0.51 |
| 6 | 0.41 | 0.47 | 0.65 | 0.57 | 0.46 | 1.00 | 0.45 | 0.38 | 0.45 | 0.44 |
| 7 | 0.35 | 0.41 | 0.46 | 0.47 | 0.65 | 0.45 | 1.00 | 0.50 | 0.53 | 0.51 |
| 8 | 0.33 | 0.36 | 0.38 | 0.39 | 0.48 | 0.38 | 0.50 | 1.00 | 0.46 | 0.51 |
| 9 | 0.34 | 0.42 | 0.43 | 0.45 | 0.57 | 0.45 | 0.53 | 0.46 | 1.00 | 0.56 |
| 10 | 0.35 | 0.39 | 0.43 | 0.46 | 0.51 | 0.44 | 0.51 | 0.51 | 0.56 | 1.00 |
The table contains GDT_TS values (calculated on the Cα atoms) between the predicted models.
Read more about the global distance test (GDT, also written as GDT_TS to represent "total score") measure.
© Laboratory of Theory of Biopolymers, Faculty of Chemistry, University of Warsaw 2013