Status: Done started: 2018-Aug-27 16:32:17 UTC
| Project Name | |
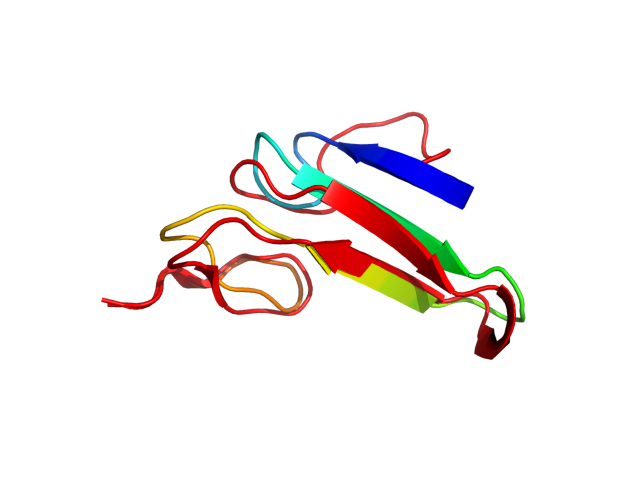
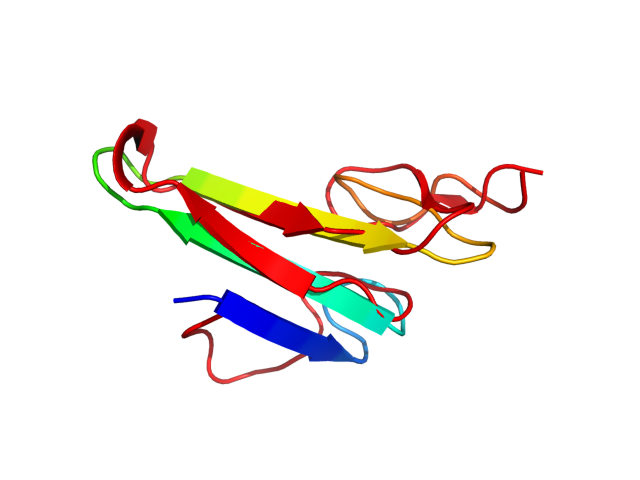
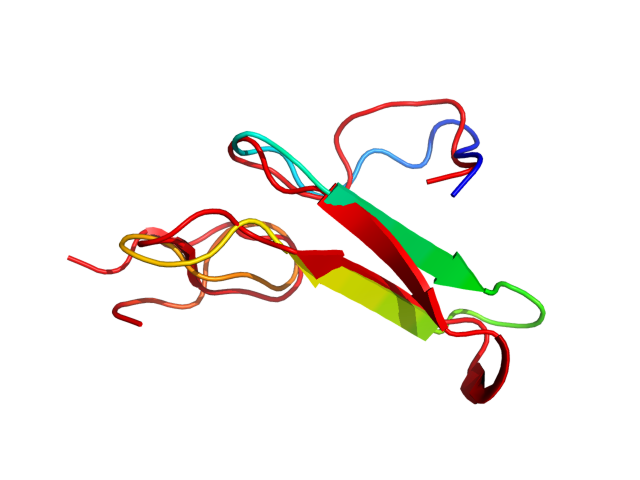
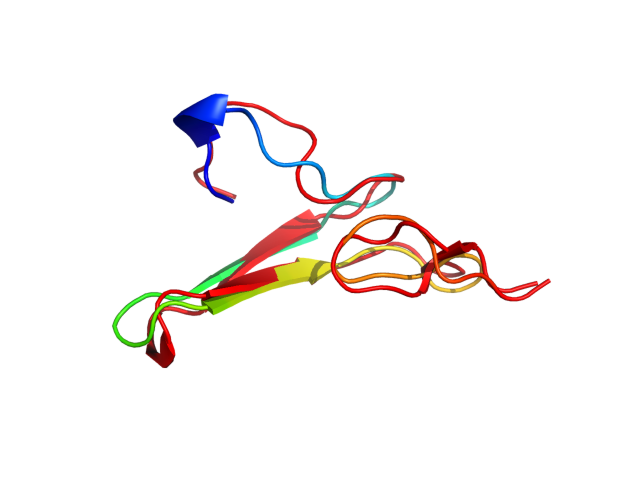
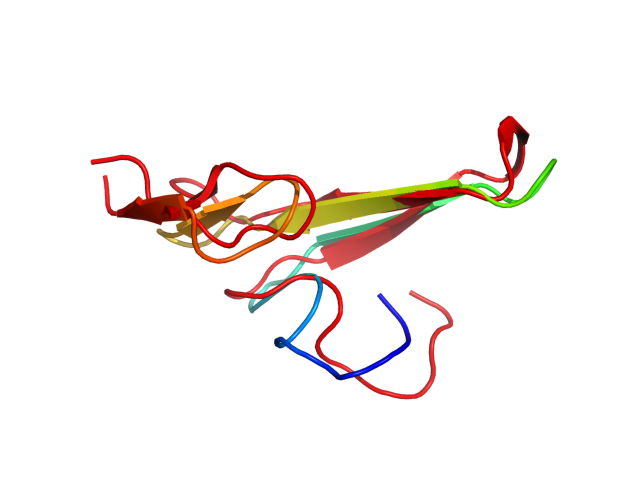
| Sequence | CPLSHDGYCL HDGVCMYIEA LDKYACNCVV GYIGERCQYR DL |
| Secondary structure | CCCCCCCCCC CCCEEEEECC CCEEEEECCC CEECCCCCEE CC |
| Movie from predicted structures | To download the movie, right click on the desired file format:  
|
| Estimated finish time | 2018-Aug-27 20:56 UTC |
| Project Name |
| Project Name |
| Cluster # | 1 | 2 | 3 | 4 | 5 | 6 | 7 | 8 | 9 | 10 | 11 | 12 |
| Cluster density | 234.7 | 205.9 | 164.5 | 152.8 | 139.7 | 80.9 | 76.7 | 69.0 | 62.8 | 53.3 | 48.0 | 17.2 |
| Cluster size | 301 | 282 | 210 | 235 | 179 | 170 | 152 | 113 | 119 | 110 | 95 | 34 |
| Average cluster RMSD | 1.3 | 1.4 | 1.3 | 1.5 | 1.3 | 2.1 | 2.0 | 1.6 | 1.9 | 2.1 | 2.0 | 2.0 |
| # | 1 | 2 | 3 | 4 | 5 | 6 | 7 | 8 | 9 | 10 | 11 | 12 |
| RMSD | 3.21 | 3.28 | 3.26 | 2.93 | 3.28 | 3.34 | 3.13 | 2.91 | 3.19 | 2.97 | 2.53 | 3.20 |
| GDT_TS | 0.67 | 0.67 | 0.68 | 0.73 | 0.66 | 0.64 | 0.69 | 0.66 | 0.62 | 0.68 | 0.70 | 0.65 |
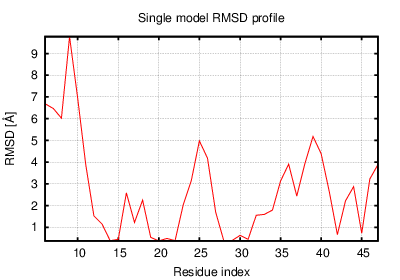
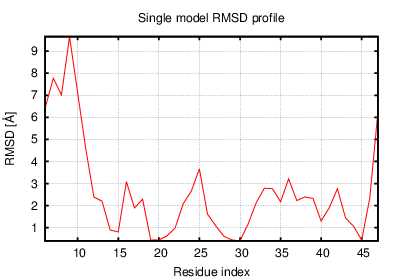
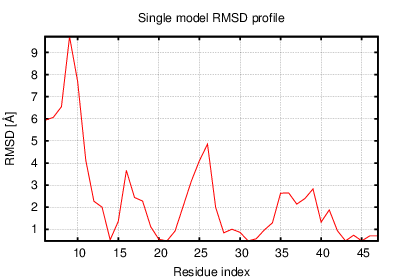
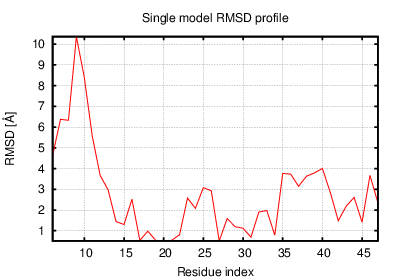
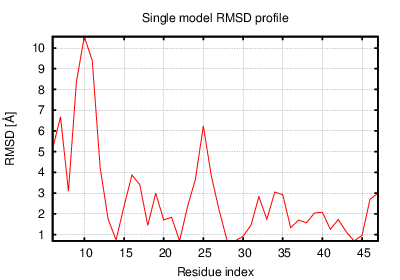
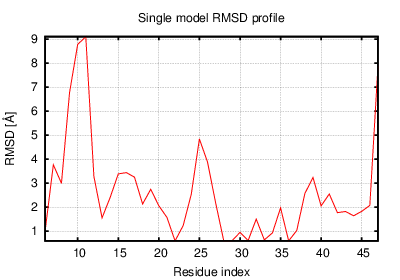
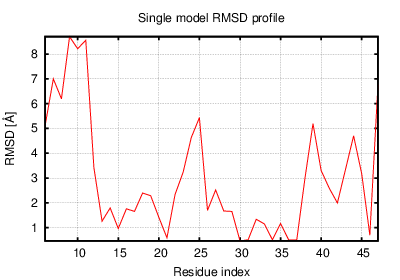
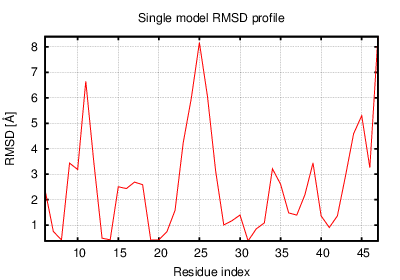
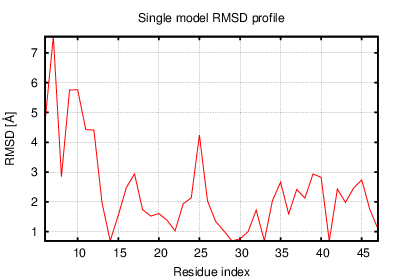
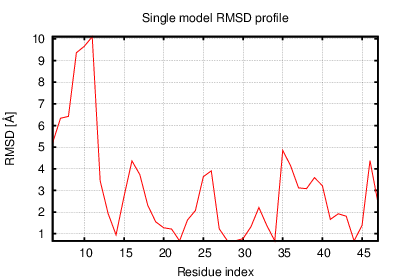
The table contains RMSD and GDT_TS values (calculated on the Cα atoms) between the predicted models and the input structure. Note that GDT_TS metric is intended as a more accurate measurement than the more common RMSD.
Read more about the root-mean-square deviation (RMSD) measure
Read more about the global distance test (GDT, also written as GDT_TS to represent "total score") measure.
| # | 1 | 2 | 3 | 4 | 5 | 6 | 7 | 8 | 9 | 10 | 11 | 12 |
| 1 | 0.00 | 1.61 | 1.89 | 1.24 | 1.68 | 4.22 | 4.05 | 4.28 | 4.46 | 3.69 | 4.19 | 3.97 |
| 2 | 1.61 | 0.00 | 1.48 | 1.45 | 1.32 | 4.17 | 3.97 | 4.25 | 4.29 | 3.56 | 4.18 | 3.82 |
| 3 | 1.89 | 1.48 | 0.00 | 1.64 | 1.61 | 4.26 | 4.01 | 4.49 | 4.41 | 3.78 | 4.41 | 4.03 |
| 4 | 1.24 | 1.45 | 1.64 | 0.00 | 1.46 | 4.16 | 3.82 | 4.14 | 4.30 | 3.53 | 4.07 | 3.79 |
| 5 | 1.68 | 1.32 | 1.61 | 1.46 | 0.00 | 4.29 | 4.15 | 4.43 | 4.38 | 3.93 | 4.27 | 3.82 |
| 6 | 4.22 | 4.17 | 4.26 | 4.16 | 4.29 | 0.00 | 2.16 | 2.60 | 2.07 | 3.26 | 2.60 | 2.36 |
| 7 | 4.05 | 3.97 | 4.01 | 3.82 | 4.15 | 2.16 | 0.00 | 2.33 | 2.58 | 2.56 | 2.78 | 2.77 |
| 8 | 4.28 | 4.25 | 4.49 | 4.14 | 4.43 | 2.60 | 2.33 | 0.00 | 2.02 | 2.75 | 2.24 | 2.84 |
| 9 | 4.46 | 4.29 | 4.41 | 4.30 | 4.38 | 2.07 | 2.58 | 2.02 | 0.00 | 3.29 | 2.02 | 2.35 |
| 10 | 3.69 | 3.56 | 3.78 | 3.53 | 3.93 | 3.26 | 2.56 | 2.75 | 3.29 | 0.00 | 2.73 | 3.87 |
| 11 | 4.19 | 4.18 | 4.41 | 4.07 | 4.27 | 2.60 | 2.78 | 2.24 | 2.02 | 2.73 | 0.00 | 2.95 |
| 12 | 3.97 | 3.82 | 4.03 | 3.79 | 3.82 | 2.36 | 2.77 | 2.84 | 2.35 | 3.87 | 2.95 | 0.00 |
The table contains RMSD values (calculated on the Cα atoms) between the predicted models.
Read more about the root-mean-square deviation (RMSD) measure.
| # | 1 | 2 | 3 | 4 | 5 | 6 | 7 | 8 | 9 | 10 | 11 | 12 |
| 1 | 1.00 | 0.84 | 0.83 | 0.87 | 0.81 | 0.67 | 0.67 | 0.67 | 0.65 | 0.67 | 0.65 | 0.70 |
| 2 | 0.84 | 1.00 | 0.86 | 0.87 | 0.88 | 0.73 | 0.68 | 0.68 | 0.75 | 0.67 | 0.68 | 0.78 |
| 3 | 0.83 | 0.86 | 1.00 | 0.89 | 0.84 | 0.76 | 0.74 | 0.65 | 0.70 | 0.66 | 0.72 | 0.75 |
| 4 | 0.87 | 0.87 | 0.89 | 1.00 | 0.84 | 0.70 | 0.73 | 0.68 | 0.68 | 0.70 | 0.72 | 0.74 |
| 5 | 0.81 | 0.88 | 0.84 | 0.84 | 1.00 | 0.73 | 0.70 | 0.67 | 0.74 | 0.64 | 0.70 | 0.79 |
| 6 | 0.67 | 0.73 | 0.76 | 0.70 | 0.73 | 1.00 | 0.76 | 0.71 | 0.77 | 0.68 | 0.77 | 0.82 |
| 7 | 0.67 | 0.68 | 0.74 | 0.73 | 0.70 | 0.76 | 1.00 | 0.74 | 0.72 | 0.73 | 0.76 | 0.71 |
| 8 | 0.67 | 0.68 | 0.65 | 0.68 | 0.67 | 0.71 | 0.74 | 1.00 | 0.77 | 0.70 | 0.76 | 0.68 |
| 9 | 0.65 | 0.75 | 0.70 | 0.68 | 0.74 | 0.77 | 0.72 | 0.77 | 1.00 | 0.67 | 0.74 | 0.77 |
| 10 | 0.67 | 0.67 | 0.66 | 0.70 | 0.64 | 0.68 | 0.73 | 0.70 | 0.67 | 1.00 | 0.74 | 0.64 |
| 11 | 0.65 | 0.68 | 0.72 | 0.72 | 0.70 | 0.77 | 0.76 | 0.76 | 0.74 | 0.74 | 1.00 | 0.72 |
| 12 | 0.70 | 0.78 | 0.75 | 0.74 | 0.79 | 0.82 | 0.71 | 0.68 | 0.77 | 0.64 | 0.72 | 1.00 |
The table contains GDT_TS values (calculated on the Cα atoms) between the predicted models.
Read more about the global distance test (GDT, also written as GDT_TS to represent "total score") measure.
© Laboratory of Theory of Biopolymers, Faculty of Chemistry, University of Warsaw 2013