Status: Done started: 2018-Mar-13 10:38:49 UTC
| Project Name | Geo71_11LNRFM5 |
| Sequence | SCAKKPRISA LRAPQLDQRY KDSFTIGAAV EPYQLQNEKD VQMLKRHFNS IVAENVMKPI NIQPEEGKFN FAEADQIVEF AKKHHMDIRF HTLVWHSQVP QWFFLDKCGK PMVNETDPAK REENKQLLLK RLETHIKTIV ERYKDDIKYW DVVNEVVGDD GKLRNSPWYE IAGIDYIKAA FQTARTYGGN KIKLYINDYN TEVEPKREAL YNLVKQLKEE GVPIDGIGPQ SHIQIGWPSE EEIEKTITMF ADLGLDNQIT ELDVSMYGWP PRAYCSYDAI PEQKFLDQAA RYDRLFKLYE KLGDKISNVT FWGIADDHTW LDSRADVYYD ADGNVVVDPI APYTSVEKGK CKDAPFVFDP EYNVKPAYCA IIDHK |
| Secondary structure | CCCCCCCCCC CCCCCHHHHC CCCCEEEEEE CHHHHHCHHH HHHHHHHCCE EEECCCCCHH HHCCCCCCCC CHHHHHHHHH HHCCCCCEEE EEEECCCCCC CCCCCCCCCC CCCCCCCHHH HHHHHHHHHH HHHHHHHHHH HHHCCCEEEE EEECCCCCCC CCCCCCHHHH HHCCHHHHHH HHHHHHHHCC CCEEEECCCC CCCHHHHHHH HHHHHHHHHH CCCCCEECCE EEEECCCCCH HHHHHHHHHH HHCCCEEEEE EEEEECCCCC CCCCCCCCCC CHHHHHHHHH HHHHHHHHHH HCCCCEEEEE ECCCCCCCCC HHHHCCEEEC CCCCCCCCCC CCCCEEECCC CCCCCCCCCC CCCCCHHHHH HHCCC |
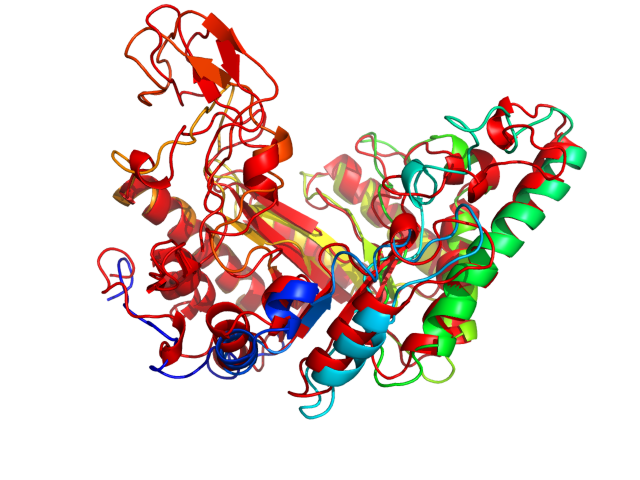
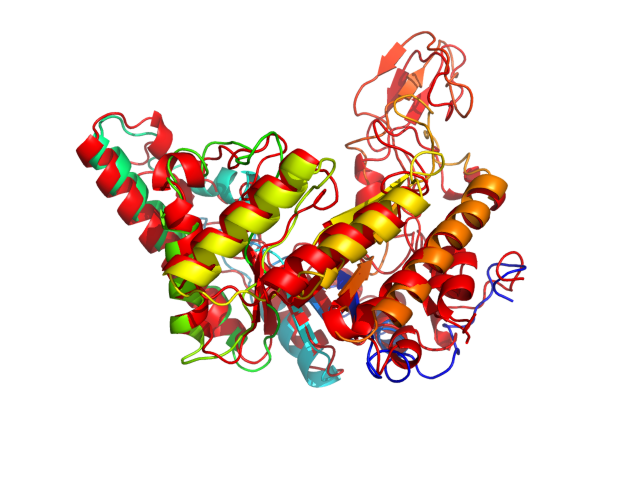
| Movie from predicted structures | To download the movie, right click on the desired file format:  
|
| Estimated finish time | 2018-Mar-13 14:47 UTC |
| Project Name | Geo71_11LNRFM5 |
| Project Name | Geo71_11LNRFM5 |
| Cluster # | 1 | 2 | 3 | 4 | 5 | 6 | 7 | 8 | 9 | 10 | 11 | 12 |
| Cluster density | 209.4 | 196.1 | 160.4 | 139.7 | 139.1 | 130.1 | 126.9 | 123.3 | 122.4 | 93.1 | 70.5 | 42.4 |
| Cluster size | 285 | 276 | 209 | 172 | 178 | 158 | 160 | 157 | 152 | 116 | 86 | 51 |
| Average cluster RMSD | 1.4 | 1.4 | 1.3 | 1.2 | 1.3 | 1.2 | 1.3 | 1.3 | 1.2 | 1.2 | 1.2 | 1.2 |
| # | 1 | 2 | 3 | 4 | 5 | 6 | 7 | 8 | 9 | 10 | 11 | 12 |
| RMSD | 3.21 | 3.22 | 3.14 | 3.27 | 3.44 | 2.80 | 3.11 | 3.24 | 4.06 | 4.24 | 2.89 | 2.81 |
| GDT_TS | 0.63 | 0.62 | 0.65 | 0.63 | 0.60 | 0.66 | 0.60 | 0.63 | 0.59 | 0.54 | 0.65 | 0.65 |
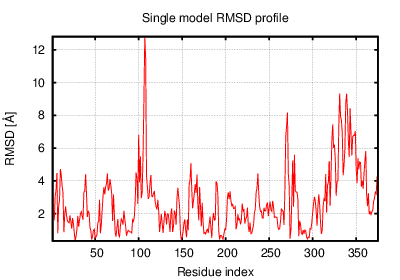
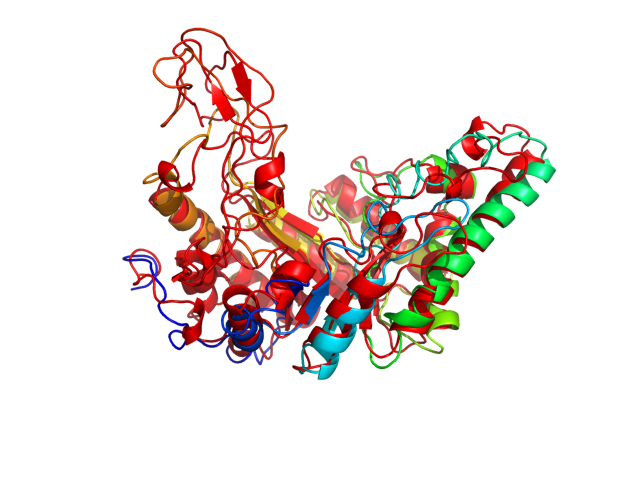
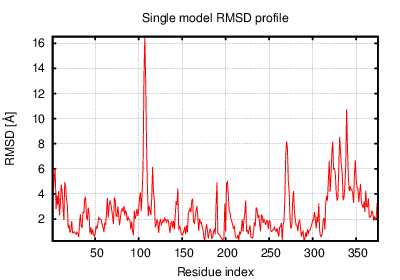
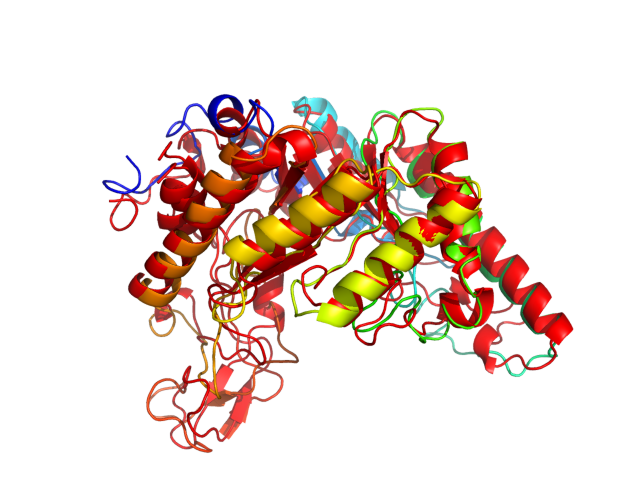
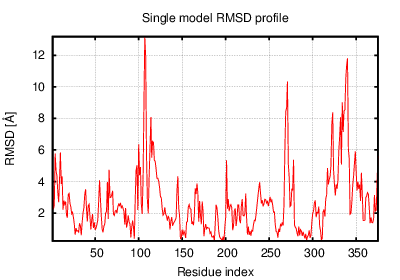
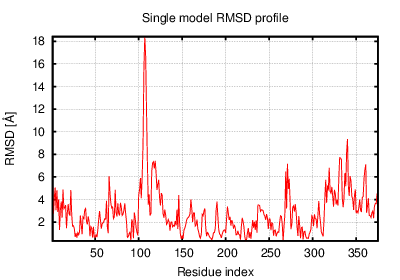
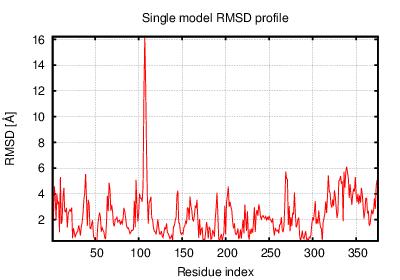
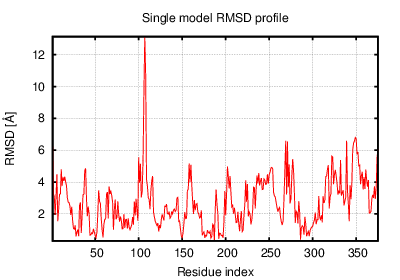
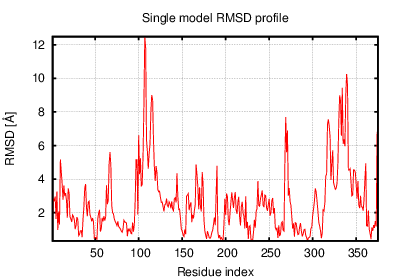
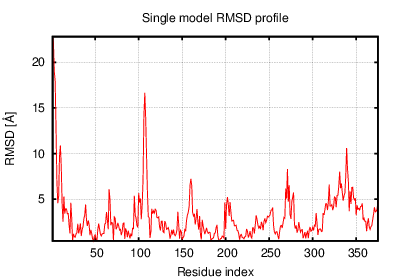
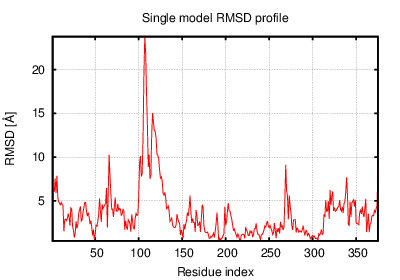
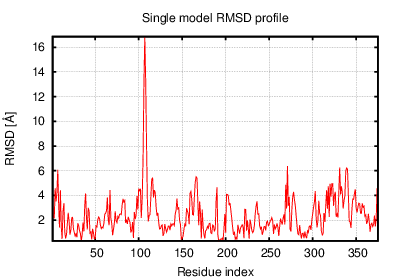
The table contains RMSD and GDT_TS values (calculated on the Cα atoms) between the predicted models and the input structure. Note that GDT_TS metric is intended as a more accurate measurement than the more common RMSD.
Read more about the root-mean-square deviation (RMSD) measure
Read more about the global distance test (GDT, also written as GDT_TS to represent "total score") measure.
| # | 1 | 2 | 3 | 4 | 5 | 6 | 7 | 8 | 9 | 10 | 11 | 12 |
| 1 | 0.00 | 2.20 | 2.48 | 2.29 | 2.36 | 2.21 | 3.01 | 2.37 | 3.49 | 3.37 | 2.20 | 2.99 |
| 2 | 2.20 | 0.00 | 2.33 | 2.28 | 2.54 | 2.24 | 2.54 | 2.38 | 3.37 | 3.46 | 2.23 | 2.87 |
| 3 | 2.48 | 2.33 | 0.00 | 2.61 | 2.29 | 2.15 | 2.39 | 2.72 | 3.23 | 3.24 | 2.14 | 2.47 |
| 4 | 2.29 | 2.28 | 2.61 | 0.00 | 2.83 | 2.34 | 2.79 | 2.04 | 3.79 | 3.67 | 2.44 | 3.05 |
| 5 | 2.36 | 2.54 | 2.29 | 2.83 | 0.00 | 2.44 | 2.67 | 2.74 | 3.15 | 2.56 | 2.30 | 2.62 |
| 6 | 2.21 | 2.24 | 2.15 | 2.34 | 2.44 | 0.00 | 2.39 | 2.53 | 3.35 | 3.30 | 1.85 | 2.47 |
| 7 | 3.01 | 2.54 | 2.39 | 2.79 | 2.67 | 2.39 | 0.00 | 2.85 | 3.24 | 3.20 | 2.53 | 2.87 |
| 8 | 2.37 | 2.38 | 2.72 | 2.04 | 2.74 | 2.53 | 2.85 | 0.00 | 3.88 | 3.55 | 2.60 | 3.15 |
| 9 | 3.49 | 3.37 | 3.23 | 3.79 | 3.15 | 3.35 | 3.24 | 3.88 | 0.00 | 3.51 | 3.31 | 3.56 |
| 10 | 3.37 | 3.46 | 3.24 | 3.67 | 2.56 | 3.30 | 3.20 | 3.55 | 3.51 | 0.00 | 3.04 | 3.58 |
| 11 | 2.20 | 2.23 | 2.14 | 2.44 | 2.30 | 1.85 | 2.53 | 2.60 | 3.31 | 3.04 | 0.00 | 2.35 |
| 12 | 2.99 | 2.87 | 2.47 | 3.05 | 2.62 | 2.47 | 2.87 | 3.15 | 3.56 | 3.58 | 2.35 | 0.00 |
The table contains RMSD values (calculated on the Cα atoms) between the predicted models.
Read more about the root-mean-square deviation (RMSD) measure.
| # | 1 | 2 | 3 | 4 | 5 | 6 | 7 | 8 | 9 | 10 | 11 | 12 |
| 1 | 1.00 | 0.75 | 0.70 | 0.71 | 0.68 | 0.71 | 0.64 | 0.70 | 0.67 | 0.60 | 0.73 | 0.61 |
| 2 | 0.75 | 1.00 | 0.72 | 0.70 | 0.68 | 0.73 | 0.68 | 0.70 | 0.67 | 0.62 | 0.73 | 0.63 |
| 3 | 0.70 | 0.72 | 1.00 | 0.68 | 0.71 | 0.75 | 0.71 | 0.67 | 0.70 | 0.63 | 0.75 | 0.69 |
| 4 | 0.71 | 0.70 | 0.68 | 1.00 | 0.65 | 0.72 | 0.66 | 0.74 | 0.65 | 0.58 | 0.69 | 0.64 |
| 5 | 0.68 | 0.68 | 0.71 | 0.65 | 1.00 | 0.68 | 0.67 | 0.64 | 0.73 | 0.68 | 0.69 | 0.66 |
| 6 | 0.71 | 0.73 | 0.75 | 0.72 | 0.68 | 1.00 | 0.71 | 0.69 | 0.70 | 0.64 | 0.77 | 0.68 |
| 7 | 0.64 | 0.68 | 0.71 | 0.66 | 0.67 | 0.71 | 1.00 | 0.62 | 0.68 | 0.62 | 0.68 | 0.64 |
| 8 | 0.70 | 0.70 | 0.67 | 0.74 | 0.64 | 0.69 | 0.62 | 1.00 | 0.62 | 0.60 | 0.67 | 0.63 |
| 9 | 0.67 | 0.67 | 0.70 | 0.65 | 0.73 | 0.70 | 0.68 | 0.62 | 1.00 | 0.65 | 0.70 | 0.66 |
| 10 | 0.60 | 0.62 | 0.63 | 0.58 | 0.68 | 0.64 | 0.62 | 0.60 | 0.65 | 1.00 | 0.63 | 0.61 |
| 11 | 0.73 | 0.73 | 0.75 | 0.69 | 0.69 | 0.77 | 0.68 | 0.67 | 0.70 | 0.63 | 1.00 | 0.69 |
| 12 | 0.61 | 0.63 | 0.69 | 0.64 | 0.66 | 0.68 | 0.64 | 0.63 | 0.66 | 0.61 | 0.69 | 1.00 |
The table contains GDT_TS values (calculated on the Cα atoms) between the predicted models.
Read more about the global distance test (GDT, also written as GDT_TS to represent "total score") measure.
© Laboratory of Theory of Biopolymers, Faculty of Chemistry, University of Warsaw 2013