Status: Done started: 2018-Mar-17 08:44:36 UTC
| Project Name | free306 |
| Sequence | GQQLAIEAPV DADLVSTVPE SATPAALAYA GKCGLPYVEV LCKNRYVGRT FIQPNMRLRQ LGVAKKFGVL SDNFKGKRIV LVDDSIVRGN TISPIIKLLK ESGAKEVHIR VASPPIKYPC FMGINIPTKE ELIAN |
| Secondary structure | CHHHHHHCCC CCCEEECCCC CCHHHHHHHH HHHCCCCCCC EEECCCCCCC CCCCCHHHHH HCCCCCEEEC HHHHCCCEEE EEECCCCCCC CHHHHHHHHH HCCCCEEEEE ECCCCCCCCC CCCCCCCCCC CCCCC |
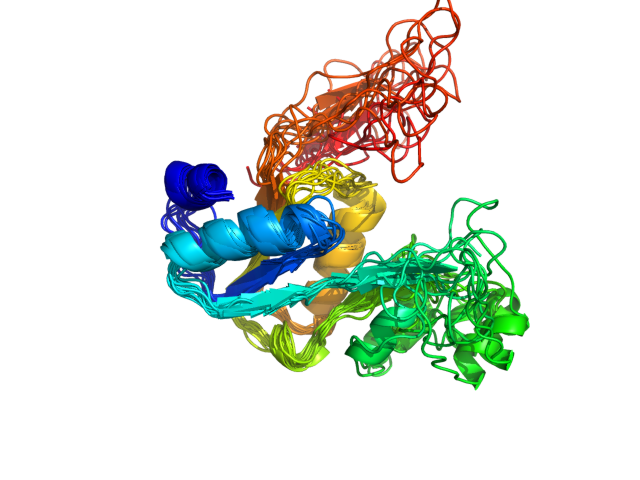
| Movie from predicted structures | To download the movie, right click on the desired file format:  
|
| Estimated finish time | 2018-Mar-17 12:21 UTC |
| Project Name | free306 |


| Project Name | free306 |
| Cluster # | 1 | 2 | 3 | 4 | 5 | 6 | 7 | 8 | 9 | 10 | 11 | 12 |
| Cluster density | 121.7 | 112.1 | 95.6 | 87.7 | 86.2 | 84.5 | 73.9 | 67.5 | 59.5 | 47.3 | 42.2 | 19.9 |
| Cluster size | 282 | 208 | 213 | 236 | 190 | 185 | 185 | 143 | 128 | 116 | 69 | 45 |
| Average cluster RMSD | 2.3 | 1.9 | 2.2 | 2.7 | 2.2 | 2.2 | 2.5 | 2.1 | 2.2 | 2.5 | 1.6 | 2.3 |
| # | 1 | 2 | 3 | 4 | 5 | 6 | 7 | 8 | 9 | 10 | 11 | 12 |
| RMSD | 5.01 | 5.61 | 5.31 | 4.06 | 5.75 | 4.63 | 4.90 | 5.31 | 7.01 | 3.72 | 4.75 | 4.93 |
| GDT_TS | 0.62 | 0.64 | 0.62 | 0.61 | 0.59 | 0.61 | 0.64 | 0.60 | 0.59 | 0.61 | 0.60 | 0.61 |
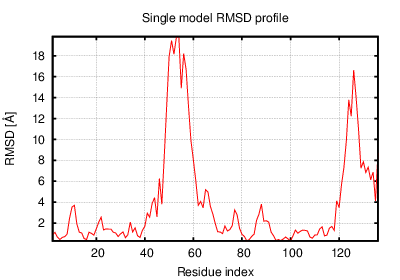
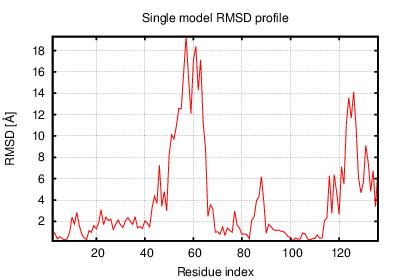
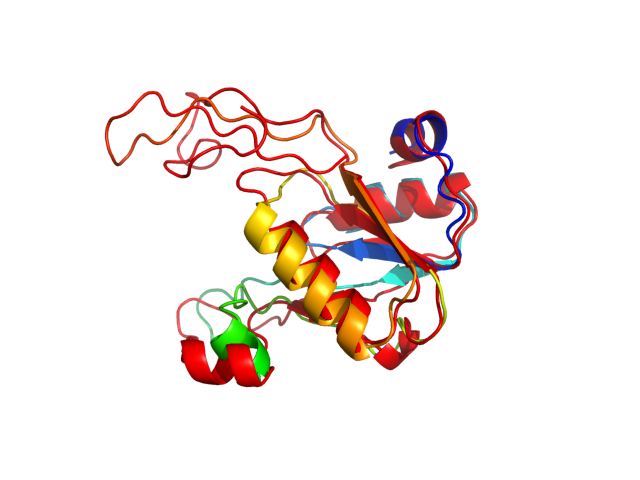
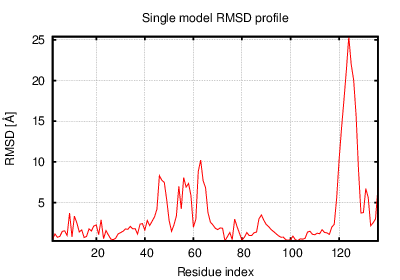
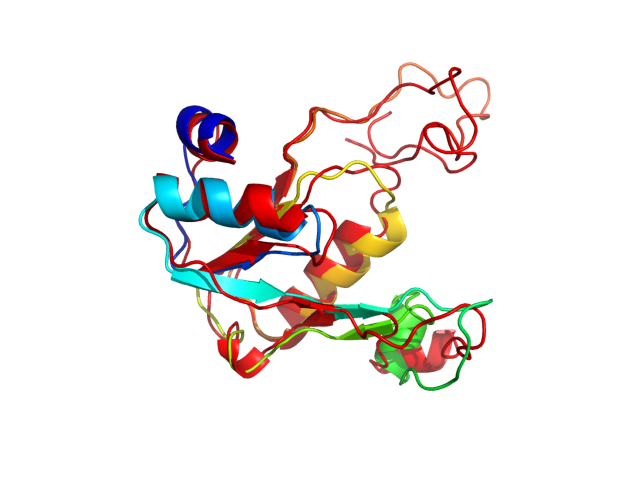
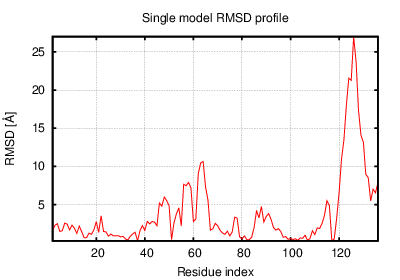
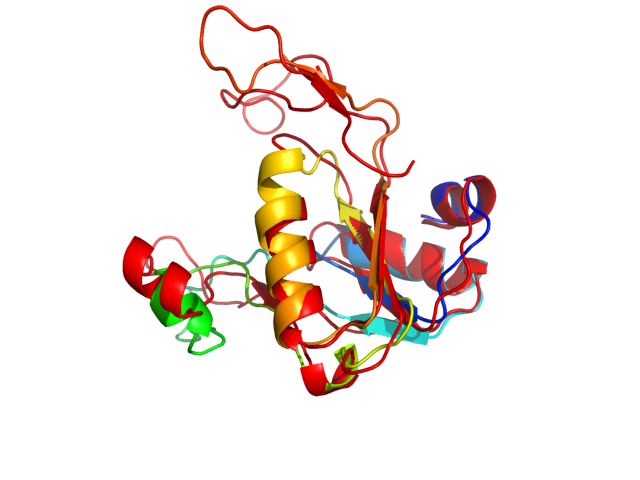
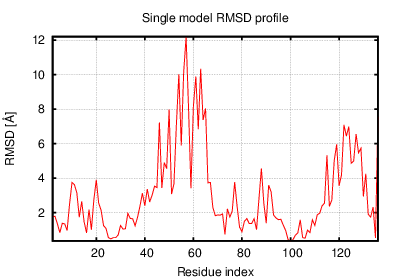
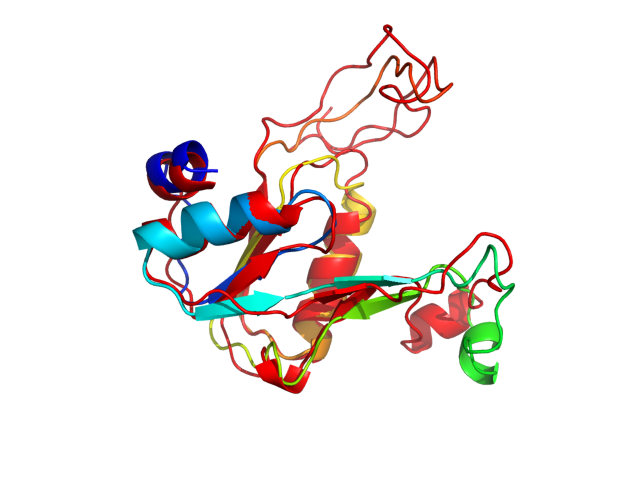
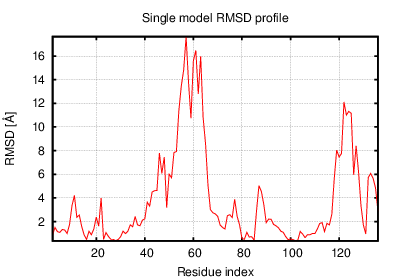
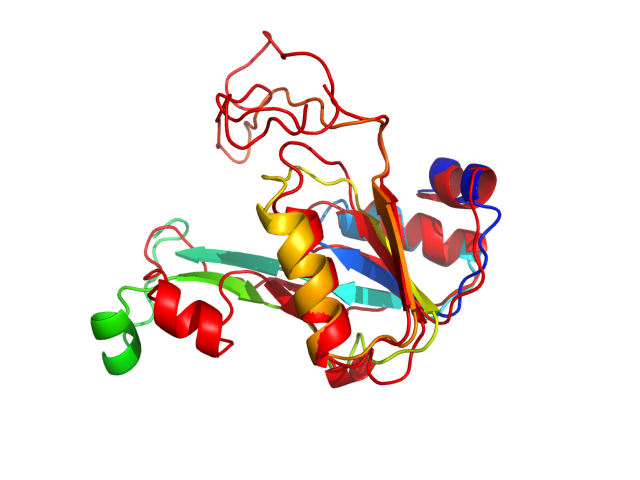
The table contains RMSD and GDT_TS values (calculated on the Cα atoms) between the predicted models and the input structure. Note that GDT_TS metric is intended as a more accurate measurement than the more common RMSD.
Read more about the root-mean-square deviation (RMSD) measure
Read more about the global distance test (GDT, also written as GDT_TS to represent "total score") measure.
| # | 1 | 2 | 3 | 4 | 5 | 6 | 7 | 8 | 9 | 10 | 11 | 12 |
| 1 | 0.00 | 6.74 | 3.43 | 5.27 | 7.33 | 5.53 | 5.42 | 5.40 | 7.51 | 4.64 | 4.68 | 4.94 |
| 2 | 6.74 | 0.00 | 5.63 | 4.63 | 2.38 | 4.39 | 5.01 | 5.04 | 4.91 | 5.64 | 7.07 | 4.98 |
| 3 | 3.43 | 5.63 | 0.00 | 5.16 | 6.14 | 4.84 | 4.88 | 4.94 | 6.46 | 4.23 | 4.84 | 3.33 |
| 4 | 5.27 | 4.63 | 5.16 | 0.00 | 4.63 | 3.32 | 4.33 | 4.08 | 5.35 | 3.58 | 4.71 | 4.90 |
| 5 | 7.33 | 2.38 | 6.14 | 4.63 | 0.00 | 4.24 | 5.25 | 5.03 | 4.24 | 5.71 | 7.08 | 5.36 |
| 6 | 5.53 | 4.39 | 4.84 | 3.32 | 4.24 | 0.00 | 3.80 | 2.70 | 4.10 | 4.11 | 5.63 | 5.04 |
| 7 | 5.42 | 5.01 | 4.88 | 4.33 | 5.25 | 3.80 | 0.00 | 3.33 | 4.71 | 5.32 | 6.29 | 4.85 |
| 8 | 5.40 | 5.04 | 4.94 | 4.08 | 5.03 | 2.70 | 3.33 | 0.00 | 3.88 | 5.36 | 6.58 | 5.60 |
| 9 | 7.51 | 4.91 | 6.46 | 5.35 | 4.24 | 4.10 | 4.71 | 3.88 | 0.00 | 6.78 | 7.70 | 6.32 |
| 10 | 4.64 | 5.64 | 4.23 | 3.58 | 5.71 | 4.11 | 5.32 | 5.36 | 6.78 | 0.00 | 3.01 | 4.13 |
| 11 | 4.68 | 7.07 | 4.84 | 4.71 | 7.08 | 5.63 | 6.29 | 6.58 | 7.70 | 3.01 | 0.00 | 4.68 |
| 12 | 4.94 | 4.98 | 3.33 | 4.90 | 5.36 | 5.04 | 4.85 | 5.60 | 6.32 | 4.13 | 4.68 | 0.00 |
The table contains RMSD values (calculated on the Cα atoms) between the predicted models.
Read more about the root-mean-square deviation (RMSD) measure.
| # | 1 | 2 | 3 | 4 | 5 | 6 | 7 | 8 | 9 | 10 | 11 | 12 |
| 1 | 1.00 | 0.64 | 0.72 | 0.63 | 0.62 | 0.59 | 0.62 | 0.62 | 0.59 | 0.64 | 0.66 | 0.64 |
| 2 | 0.64 | 1.00 | 0.64 | 0.66 | 0.77 | 0.66 | 0.63 | 0.64 | 0.65 | 0.62 | 0.62 | 0.62 |
| 3 | 0.72 | 0.64 | 1.00 | 0.64 | 0.62 | 0.62 | 0.63 | 0.65 | 0.61 | 0.66 | 0.70 | 0.68 |
| 4 | 0.63 | 0.66 | 0.64 | 1.00 | 0.66 | 0.69 | 0.73 | 0.70 | 0.67 | 0.72 | 0.68 | 0.64 |
| 5 | 0.62 | 0.77 | 0.62 | 0.66 | 1.00 | 0.64 | 0.62 | 0.67 | 0.71 | 0.62 | 0.62 | 0.60 |
| 6 | 0.59 | 0.66 | 0.62 | 0.69 | 0.64 | 1.00 | 0.67 | 0.73 | 0.68 | 0.65 | 0.59 | 0.57 |
| 7 | 0.62 | 0.63 | 0.63 | 0.73 | 0.62 | 0.67 | 1.00 | 0.69 | 0.66 | 0.70 | 0.67 | 0.63 |
| 8 | 0.62 | 0.64 | 0.65 | 0.70 | 0.67 | 0.73 | 0.69 | 1.00 | 0.69 | 0.65 | 0.62 | 0.59 |
| 9 | 0.59 | 0.65 | 0.61 | 0.67 | 0.71 | 0.68 | 0.66 | 0.69 | 1.00 | 0.65 | 0.65 | 0.60 |
| 10 | 0.64 | 0.62 | 0.66 | 0.72 | 0.62 | 0.65 | 0.70 | 0.65 | 0.65 | 1.00 | 0.73 | 0.63 |
| 11 | 0.66 | 0.62 | 0.70 | 0.68 | 0.62 | 0.59 | 0.67 | 0.62 | 0.65 | 0.73 | 1.00 | 0.66 |
| 12 | 0.64 | 0.62 | 0.68 | 0.64 | 0.60 | 0.57 | 0.63 | 0.59 | 0.60 | 0.63 | 0.66 | 1.00 |
The table contains GDT_TS values (calculated on the Cα atoms) between the predicted models.
Read more about the global distance test (GDT, also written as GDT_TS to represent "total score") measure.
© Laboratory of Theory of Biopolymers, Faculty of Chemistry, University of Warsaw 2013