Status: Done started: 2018-Dec-27 03:27:54 UTC
| Project Name | |
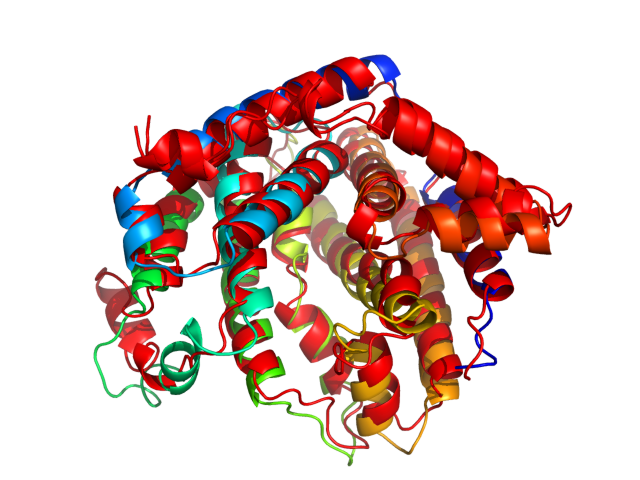
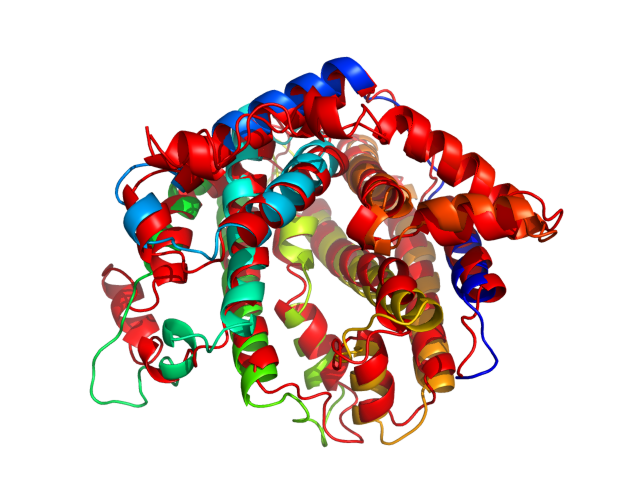
| Sequence | MENFPTEYFL NTTVRLLEYI RYRDSNYTRE ERIENLHYAY NKAAHHFAQP RQQQLLKVDP KRLQASLQTI VGMVVYSWAK VSKECMADLS IHYTYTLVLE DSKDDPYPTM VNYFDDLQAG REQAHPWWAL VNEHFPNVLR HFGPFCSLNL IRSTLDFFEG CWIEQYNFGG FPGSHDYPQF LRRMNGLGHC VGASLWPKEQ FNERSLFLEI TSAIAQMENW MVWVNDLMSF YKEFDDERDQ ISLVKNYVVS DEISLHEALE KLTQDTLHSS KQMVAVFSDK DPQVMDTIEC FMHGYVTWHL CDRRYRLSEI YEKVKEEKTE DAQKFCKFYE QAANVGAVSP SEWAYPPVAQ LANV |
| Secondary structure | CCCCCHHHHH HHHHHHHHHC CCCCCCCCHH HHHHHHHHHH HHHHHHHCCH HHHHHCCCCH HHHHHHHHHH HHHHHHHCCC CCHHHHHHHH HHHHHHHHHC CCCCCCHHHH CCHHHHHHHC CCCCCHHHHH HHHHHHHHHC CCCHHHHHHH HHHHHHHHHH HHHHCCCCCC CCCCCCHHHH HHHHHHCHHH HHHCCCCCCC CCCCCCHHHH HHHHHHHHHH HHHHHHHHHH HHHHCCCCCC CCHHHHHHHH HCCCHHHHHH HHHHHHHHHH HHHHHHHCCC CHHHHHHHHH HHHHHHHHHH HCCCCCHHHH HHHHCCCCCH HHHHHHHHHH HHHHHHCCCC CCCCCCCHHH HHHC |
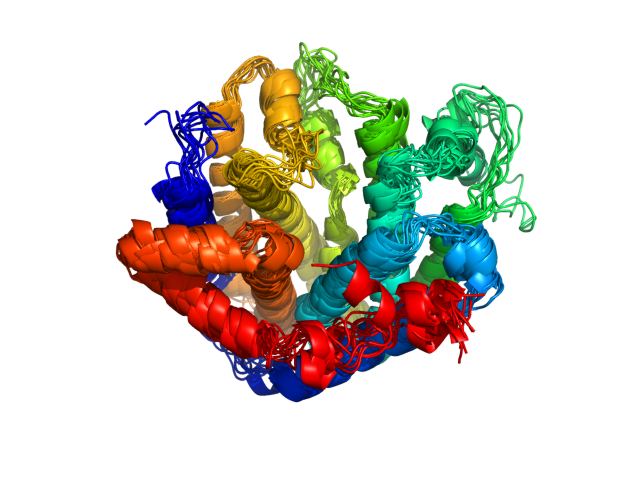
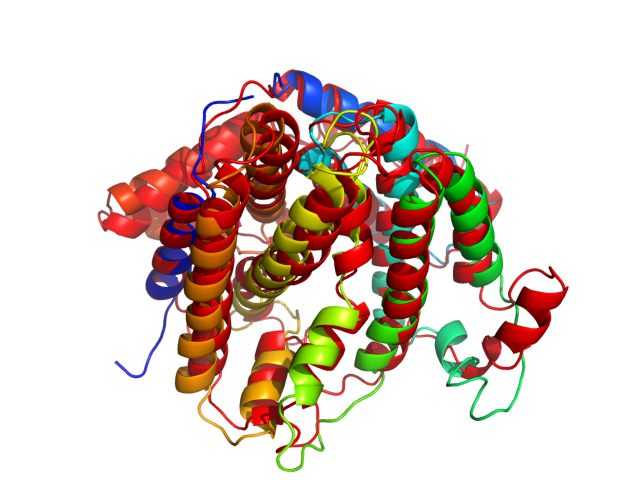
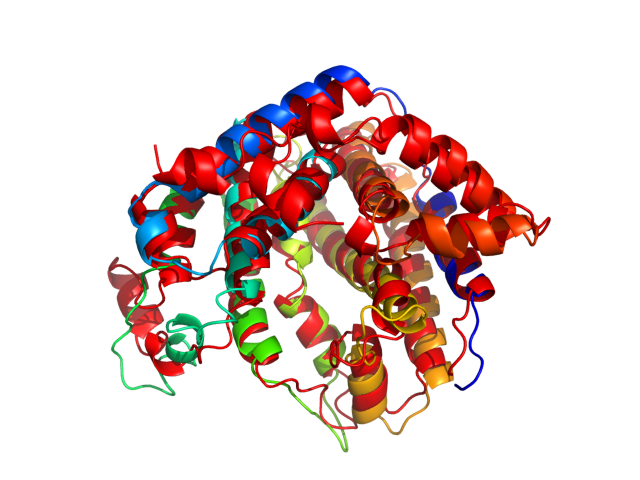
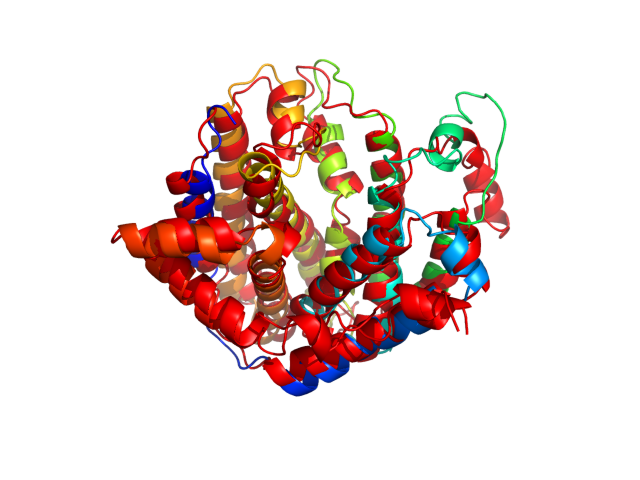
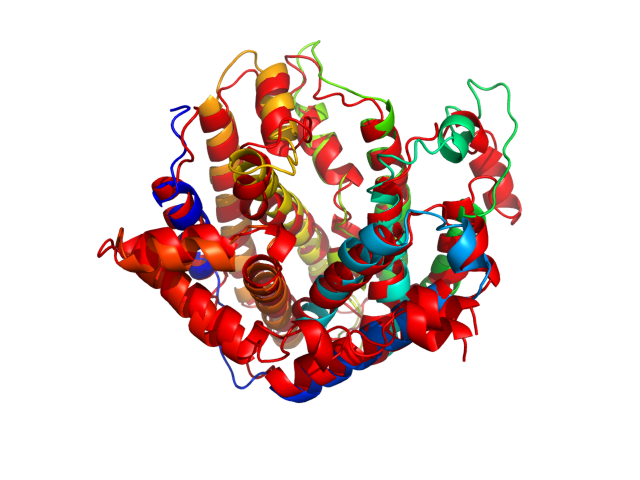
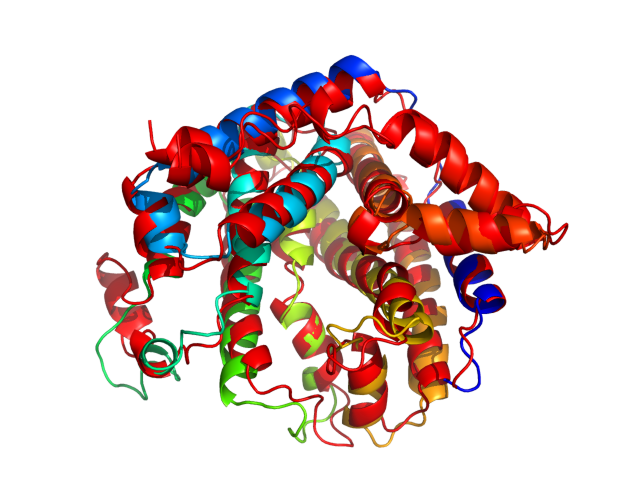
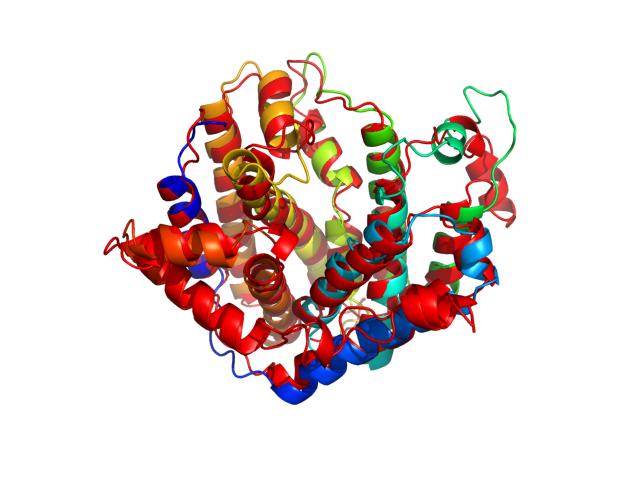
| Movie from predicted structures | To download the movie, right click on the desired file format:  
|
| Estimated finish time | 2018-Dec-27 07:33 UTC |
| Project Name |
| Project Name |
| Cluster # | 1 | 2 | 3 | 4 | 5 | 6 | 7 | 8 | 9 | 10 | 11 | 12 |
| Cluster density | 234.5 | 188.9 | 186.8 | 185.1 | 169.4 | 167.1 | 158.7 | 136.2 | 133.3 | 114.3 | 78.1 | 40.0 |
| Cluster size | 260 | 207 | 211 | 206 | 184 | 182 | 177 | 161 | 147 | 123 | 101 | 41 |
| Average cluster RMSD | 1.1 | 1.1 | 1.1 | 1.1 | 1.1 | 1.1 | 1.1 | 1.2 | 1.1 | 1.1 | 1.3 | 1.0 |
| # | 1 | 2 | 3 | 4 | 5 | 6 | 7 | 8 | 9 | 10 | 11 | 12 |
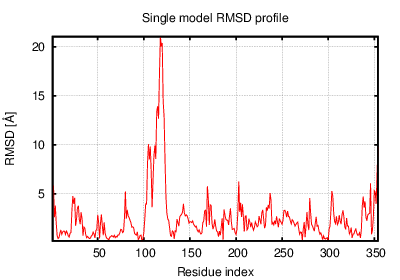
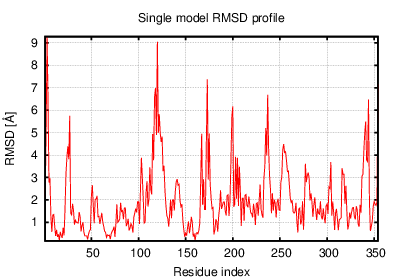
| RMSD | 3.47 | 3.64 | 3.98 | 3.30 | 3.36 | 3.80 | 3.51 | 3.23 | 3.53 | 3.57 | 2.45 | 2.51 |
| GDT_TS | 0.66 | 0.65 | 0.68 | 0.65 | 0.69 | 0.66 | 0.69 | 0.67 | 0.69 | 0.67 | 0.72 | 0.68 |
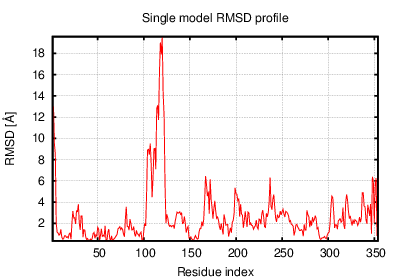
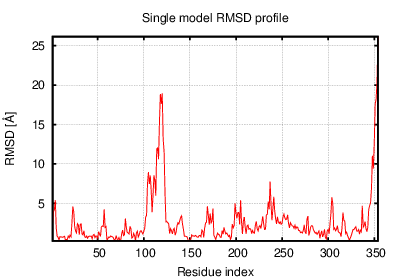
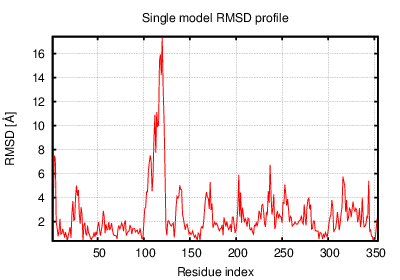
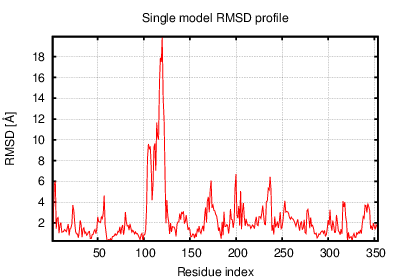
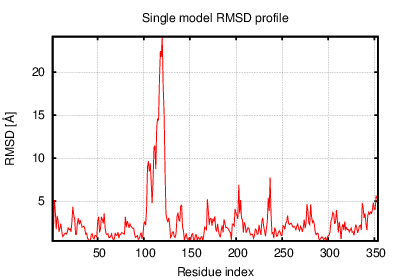
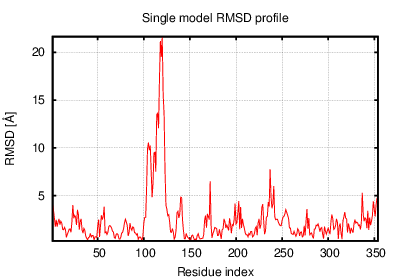
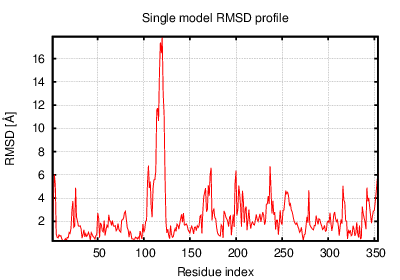
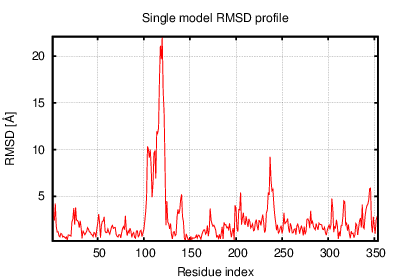
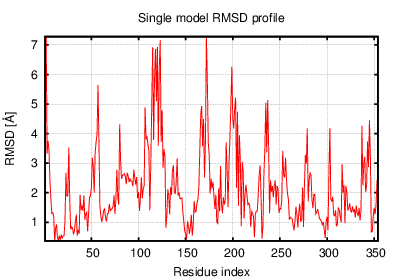
The table contains RMSD and GDT_TS values (calculated on the Cα atoms) between the predicted models and the input structure. Note that GDT_TS metric is intended as a more accurate measurement than the more common RMSD.
Read more about the root-mean-square deviation (RMSD) measure
Read more about the global distance test (GDT, also written as GDT_TS to represent "total score") measure.
| # | 1 | 2 | 3 | 4 | 5 | 6 | 7 | 8 | 9 | 10 | 11 | 12 |
| 1 | 0.00 | 2.03 | 2.73 | 1.98 | 1.91 | 2.04 | 1.99 | 2.33 | 1.93 | 2.03 | 2.91 | 3.65 |
| 2 | 2.03 | 0.00 | 3.07 | 2.09 | 2.28 | 2.39 | 2.10 | 2.73 | 2.46 | 2.08 | 3.30 | 3.73 |
| 3 | 2.73 | 3.07 | 0.00 | 3.11 | 2.87 | 2.90 | 2.90 | 2.96 | 2.86 | 2.76 | 3.43 | 4.25 |
| 4 | 1.98 | 2.09 | 3.11 | 0.00 | 2.11 | 2.36 | 2.00 | 2.27 | 2.20 | 2.18 | 2.90 | 3.47 |
| 5 | 1.91 | 2.28 | 2.87 | 2.11 | 0.00 | 2.13 | 1.99 | 1.98 | 1.81 | 2.10 | 2.87 | 3.47 |
| 6 | 2.04 | 2.39 | 2.90 | 2.36 | 2.13 | 0.00 | 1.87 | 2.41 | 1.94 | 1.88 | 3.46 | 4.02 |
| 7 | 1.99 | 2.10 | 2.90 | 2.00 | 1.99 | 1.87 | 0.00 | 2.30 | 1.83 | 1.93 | 3.24 | 3.72 |
| 8 | 2.33 | 2.73 | 2.96 | 2.27 | 1.98 | 2.41 | 2.30 | 0.00 | 2.22 | 2.23 | 2.69 | 3.63 |
| 9 | 1.93 | 2.46 | 2.86 | 2.20 | 1.81 | 1.94 | 1.83 | 2.22 | 0.00 | 2.12 | 3.16 | 3.73 |
| 10 | 2.03 | 2.08 | 2.76 | 2.18 | 2.10 | 1.88 | 1.93 | 2.23 | 2.12 | 0.00 | 3.23 | 3.76 |
| 11 | 2.91 | 3.30 | 3.43 | 2.90 | 2.87 | 3.46 | 3.24 | 2.69 | 3.16 | 3.23 | 0.00 | 2.46 |
| 12 | 3.65 | 3.73 | 4.25 | 3.47 | 3.47 | 4.02 | 3.72 | 3.63 | 3.73 | 3.76 | 2.46 | 0.00 |
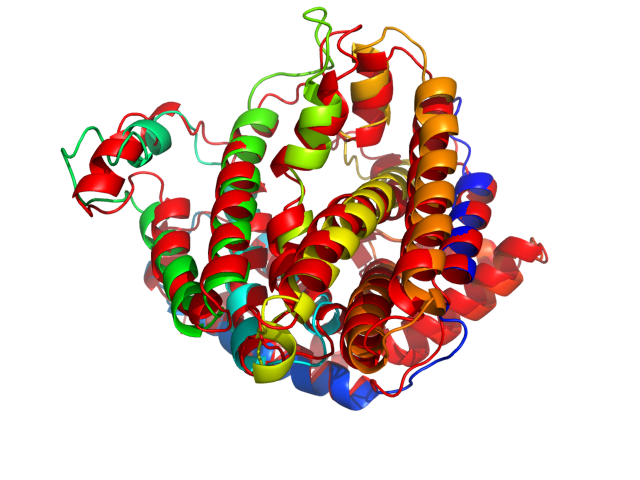
The table contains RMSD values (calculated on the Cα atoms) between the predicted models.
Read more about the root-mean-square deviation (RMSD) measure.
| # | 1 | 2 | 3 | 4 | 5 | 6 | 7 | 8 | 9 | 10 | 11 | 12 |
| 1 | 1.00 | 0.77 | 0.78 | 0.76 | 0.76 | 0.77 | 0.76 | 0.73 | 0.76 | 0.75 | 0.73 | 0.70 |
| 2 | 0.77 | 1.00 | 0.73 | 0.79 | 0.72 | 0.74 | 0.75 | 0.68 | 0.71 | 0.77 | 0.70 | 0.67 |
| 3 | 0.78 | 0.73 | 1.00 | 0.72 | 0.77 | 0.73 | 0.75 | 0.71 | 0.78 | 0.73 | 0.76 | 0.68 |
| 4 | 0.76 | 0.79 | 0.72 | 1.00 | 0.72 | 0.73 | 0.75 | 0.71 | 0.71 | 0.75 | 0.71 | 0.66 |
| 5 | 0.76 | 0.72 | 0.77 | 0.72 | 1.00 | 0.72 | 0.73 | 0.75 | 0.78 | 0.73 | 0.76 | 0.71 |
| 6 | 0.77 | 0.74 | 0.73 | 0.73 | 0.72 | 1.00 | 0.79 | 0.69 | 0.75 | 0.78 | 0.71 | 0.68 |
| 7 | 0.76 | 0.75 | 0.75 | 0.75 | 0.73 | 0.79 | 1.00 | 0.71 | 0.78 | 0.77 | 0.72 | 0.69 |
| 8 | 0.73 | 0.68 | 0.71 | 0.71 | 0.75 | 0.69 | 0.71 | 1.00 | 0.73 | 0.72 | 0.74 | 0.65 |
| 9 | 0.76 | 0.71 | 0.78 | 0.71 | 0.78 | 0.75 | 0.78 | 0.73 | 1.00 | 0.74 | 0.74 | 0.68 |
| 10 | 0.75 | 0.77 | 0.73 | 0.75 | 0.73 | 0.78 | 0.77 | 0.72 | 0.74 | 1.00 | 0.71 | 0.69 |
| 11 | 0.73 | 0.70 | 0.76 | 0.71 | 0.76 | 0.71 | 0.72 | 0.74 | 0.74 | 0.71 | 1.00 | 0.75 |
| 12 | 0.70 | 0.67 | 0.68 | 0.66 | 0.71 | 0.68 | 0.69 | 0.65 | 0.68 | 0.69 | 0.75 | 1.00 |
The table contains GDT_TS values (calculated on the Cα atoms) between the predicted models.
Read more about the global distance test (GDT, also written as GDT_TS to represent "total score") measure.
© Laboratory of Theory of Biopolymers, Faculty of Chemistry, University of Warsaw 2013