Status: Done started: 2018-Mar-14 15:44:28 UTC
| Project Name | 868 |
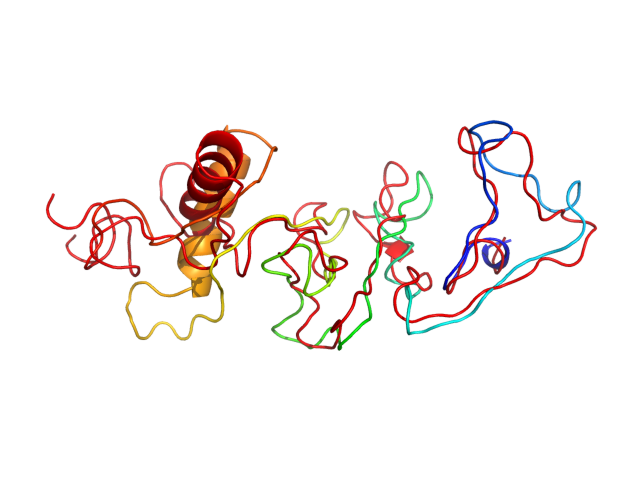
| Sequence | SEPPVVKTEM VTISDASQRT EISTKEVPIV QTETKTITYE SPQIDGGAGG DSGTLLTAQT ITSESVSTTT TTHITKTVKG GISETRIEKR IVITGDGDID HDQALAQAIR EAREQHPDMS VTRVVVHKET ELAEEGED |
| Secondary structure | CCCCCCCCCC CCCCCCCCCC CCCCCCCCCC CCCCCCCCCC CCCCCCCCCC CCCCCCCCCC CCCCCCCCCC CCCCCCCCCC CCCCCCCCCC CCCCCCCCCC HHHHHHHHHH HHHHCCCCCC CCCCCCCCCC CCCCCCCC |
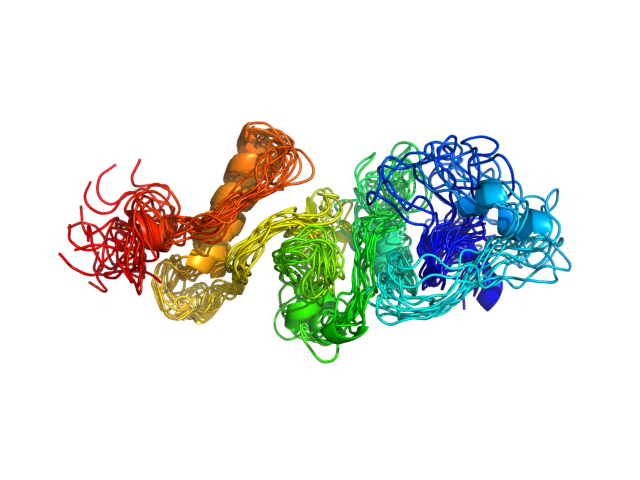
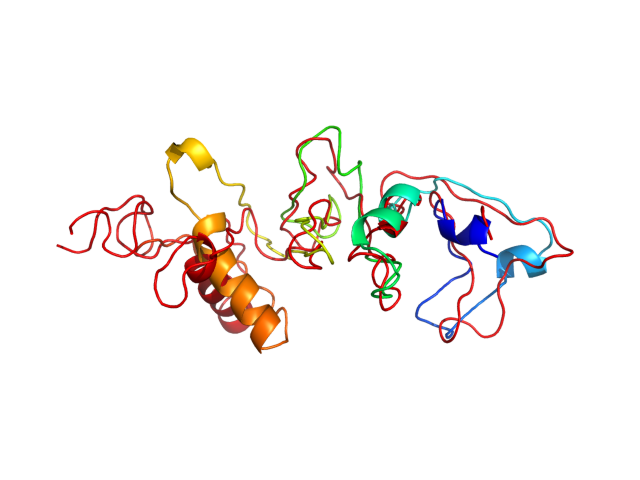
| Movie from predicted structures | To download the movie, right click on the desired file format:  
|
| Estimated finish time | 2018-Mar-14 19:21 UTC |
| Project Name | 868 |
| Project Name | 868 |
| Cluster # | 1 | 2 | 3 | 4 | 5 | 6 | 7 | 8 | 9 | 10 | 11 | 12 |
| Cluster density | 111.9 | 94.8 | 92.4 | 81.6 | 80.2 | 77.9 | 75.9 | 74.9 | 73.1 | 67.0 | 61.8 | 41.9 |
| Cluster size | 266 | 182 | 187 | 220 | 182 | 161 | 163 | 151 | 141 | 138 | 132 | 77 |
| Average cluster RMSD | 2.4 | 1.9 | 2.0 | 2.7 | 2.3 | 2.1 | 2.1 | 2.0 | 1.9 | 2.1 | 2.1 | 1.8 |
| # | 1 | 2 | 3 | 4 | 5 | 6 | 7 | 8 | 9 | 10 | 11 | 12 |
| RMSD | 6.44 | 6.20 | 7.64 | 5.94 | 6.22 | 7.87 | 7.65 | 5.57 | 8.38 | 7.27 | 4.79 | 6.93 |
| GDT_TS | 0.43 | 0.43 | 0.41 | 0.40 | 0.43 | 0.39 | 0.38 | 0.46 | 0.38 | 0.38 | 0.49 | 0.41 |
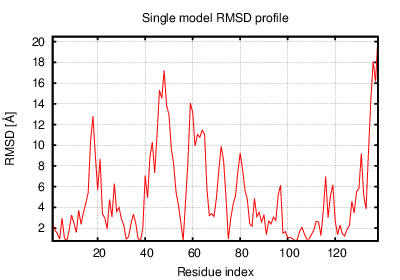
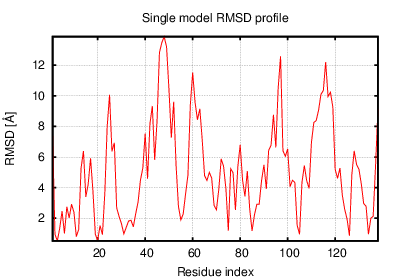
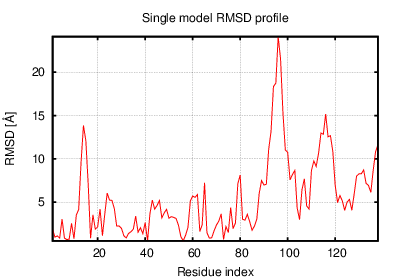
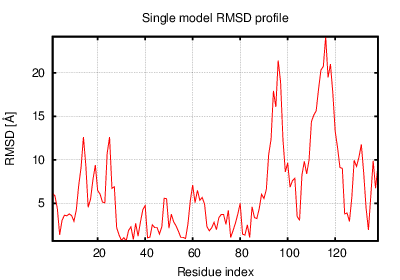
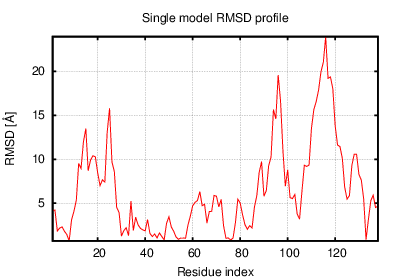
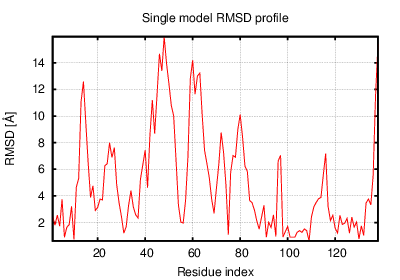
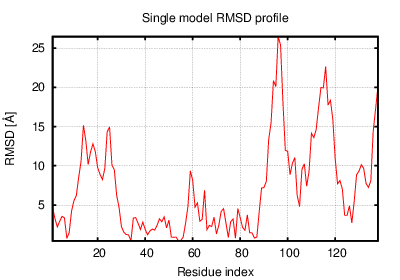
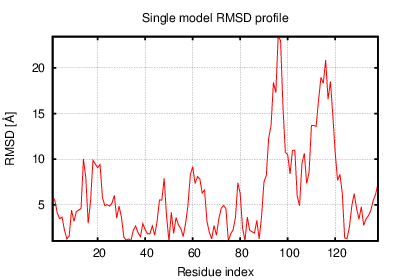
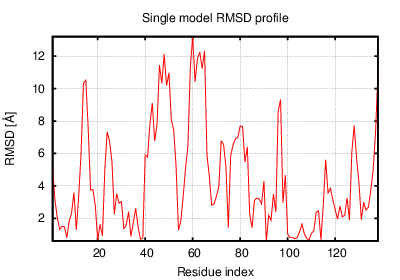
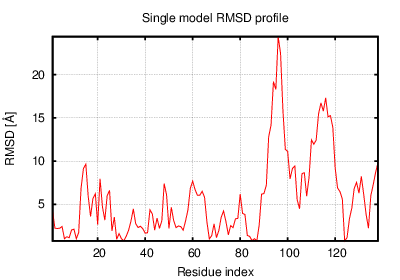
The table contains RMSD and GDT_TS values (calculated on the Cα atoms) between the predicted models and the input structure. Note that GDT_TS metric is intended as a more accurate measurement than the more common RMSD.
Read more about the root-mean-square deviation (RMSD) measure
Read more about the global distance test (GDT, also written as GDT_TS to represent "total score") measure.
| # | 1 | 2 | 3 | 4 | 5 | 6 | 7 | 8 | 9 | 10 | 11 | 12 |
| 1 | 0.00 | 6.88 | 3.91 | 4.31 | 3.90 | 3.79 | 3.94 | 5.24 | 4.41 | 4.47 | 4.56 | 4.10 |
| 2 | 6.88 | 0.00 | 7.14 | 5.14 | 7.09 | 7.57 | 7.97 | 5.06 | 7.99 | 6.37 | 5.10 | 6.53 |
| 3 | 3.91 | 7.14 | 0.00 | 4.67 | 4.16 | 3.29 | 4.16 | 5.67 | 3.21 | 3.41 | 5.58 | 3.45 |
| 4 | 4.31 | 5.14 | 4.67 | 0.00 | 4.33 | 5.31 | 5.65 | 3.29 | 5.68 | 5.10 | 3.65 | 4.63 |
| 5 | 3.90 | 7.09 | 4.16 | 4.33 | 0.00 | 5.30 | 5.34 | 4.49 | 5.44 | 4.70 | 4.80 | 4.12 |
| 6 | 3.79 | 7.57 | 3.29 | 5.31 | 5.30 | 0.00 | 3.33 | 6.46 | 2.91 | 3.96 | 6.36 | 4.06 |
| 7 | 3.94 | 7.97 | 4.16 | 5.65 | 5.34 | 3.33 | 0.00 | 6.66 | 3.66 | 5.02 | 6.41 | 5.23 |
| 8 | 5.24 | 5.06 | 5.67 | 3.29 | 4.49 | 6.46 | 6.66 | 0.00 | 6.44 | 6.01 | 3.76 | 5.37 |
| 9 | 4.41 | 7.99 | 3.21 | 5.68 | 5.44 | 2.91 | 3.66 | 6.44 | 0.00 | 4.47 | 6.54 | 4.66 |
| 10 | 4.47 | 6.37 | 3.41 | 5.10 | 4.70 | 3.96 | 5.02 | 6.01 | 4.47 | 0.00 | 5.70 | 2.92 |
| 11 | 4.56 | 5.10 | 5.58 | 3.65 | 4.80 | 6.36 | 6.41 | 3.76 | 6.54 | 5.70 | 0.00 | 5.26 |
| 12 | 4.10 | 6.53 | 3.45 | 4.63 | 4.12 | 4.06 | 5.23 | 5.37 | 4.66 | 2.92 | 5.26 | 0.00 |
The table contains RMSD values (calculated on the Cα atoms) between the predicted models.
Read more about the root-mean-square deviation (RMSD) measure.
| # | 1 | 2 | 3 | 4 | 5 | 6 | 7 | 8 | 9 | 10 | 11 | 12 |
| 1 | 1.00 | 0.49 | 0.53 | 0.57 | 0.56 | 0.53 | 0.56 | 0.53 | 0.52 | 0.49 | 0.50 | 0.50 |
| 2 | 0.49 | 1.00 | 0.46 | 0.52 | 0.45 | 0.46 | 0.47 | 0.58 | 0.46 | 0.47 | 0.54 | 0.49 |
| 3 | 0.53 | 0.46 | 1.00 | 0.53 | 0.52 | 0.61 | 0.56 | 0.47 | 0.67 | 0.59 | 0.45 | 0.56 |
| 4 | 0.57 | 0.52 | 0.53 | 1.00 | 0.56 | 0.51 | 0.54 | 0.61 | 0.48 | 0.49 | 0.54 | 0.50 |
| 5 | 0.56 | 0.45 | 0.52 | 0.56 | 1.00 | 0.47 | 0.51 | 0.53 | 0.49 | 0.46 | 0.50 | 0.53 |
| 6 | 0.53 | 0.46 | 0.61 | 0.51 | 0.47 | 1.00 | 0.59 | 0.46 | 0.66 | 0.56 | 0.43 | 0.56 |
| 7 | 0.56 | 0.47 | 0.56 | 0.54 | 0.51 | 0.59 | 1.00 | 0.48 | 0.58 | 0.49 | 0.46 | 0.49 |
| 8 | 0.53 | 0.58 | 0.47 | 0.61 | 0.53 | 0.46 | 0.48 | 1.00 | 0.47 | 0.45 | 0.55 | 0.48 |
| 9 | 0.52 | 0.46 | 0.67 | 0.48 | 0.49 | 0.66 | 0.58 | 0.47 | 1.00 | 0.56 | 0.42 | 0.55 |
| 10 | 0.49 | 0.47 | 0.59 | 0.49 | 0.46 | 0.56 | 0.49 | 0.45 | 0.56 | 1.00 | 0.41 | 0.61 |
| 11 | 0.50 | 0.54 | 0.45 | 0.54 | 0.50 | 0.43 | 0.46 | 0.55 | 0.42 | 0.41 | 1.00 | 0.44 |
| 12 | 0.50 | 0.49 | 0.56 | 0.50 | 0.53 | 0.56 | 0.49 | 0.48 | 0.55 | 0.61 | 0.44 | 1.00 |
The table contains GDT_TS values (calculated on the Cα atoms) between the predicted models.
Read more about the global distance test (GDT, also written as GDT_TS to represent "total score") measure.
© Laboratory of Theory of Biopolymers, Faculty of Chemistry, University of Warsaw 2013