Status: Done started: 2018-Nov-18 06:01:04 UTC
| Project Name | |
| Sequence | QCYHYDQTNR QGQGSHYSQP NRQGQSSHYG QPDTQDQSSH YGQTDRQDQS SHYGQTERQG QSSHYSQMDR QGQGSHYGQT DRQGQSSHYG QPDRQGQNSH YGQTDRQGQS SHYGQTDRQG QSSHYSQPDK QGQSSHYGKI DRQDQSYHYG QPDGQGQSSH YGQTDRQGQS FHYGQPDRQG QSSHYSQMDR QDQSSHYGQT DRQGQSSHYG QTDRQGQSYH YGQTDRQGQS SHYIQSQTGE IQGQNKYFQG TEGTRKASYV EQSGRSGRLS QQTPGQEGYQ NQGQGFQSRD SQQNGHQVWE |
| Secondary structure | CCCCEEEEEE CCCCCCCCCC CEEEEECCCC CCCCCEEEEE CCCCCCEEEE CCCCCCCCCC CCEEECCCCC CCCCCCEEEC CCEEECCCCC CCCCCEEECC CCCCEEECCC CCCCEEECCC CCCCCCCCCC CCCCCCCCCC CCCEEEECCC CCCEEEECCC CCCCCCCEEE CCCCCCCCCC CCCCCCCCEE EECCCCEEEE CCCCCEEEEC CCCCCCEEEE ECCCCCCCCC CCCCCCCCCC EECCCCCCEE ECCCCEEECC CCCCEEEEEE ECCCCEEEEE ECCCCEEECC CCCCCCEECC |
| Movie from predicted structures | To download the movie, right click on the desired file format:  
|
| Estimated finish time | 2018-Nov-18 09:59 UTC |
| Project Name |


| Project Name |
| Cluster # | 1 | 2 | 3 | 4 | 5 | 6 | 7 | 8 | 9 | 10 | 11 | 12 |
| Cluster density | 145.1 | 132.1 | 129.5 | 128.5 | 128.4 | 99.4 | 93.5 | 90.9 | 90.2 | 83.1 | 76.0 | 69.3 |
| Cluster size | 217 | 213 | 200 | 208 | 212 | 166 | 159 | 140 | 144 | 122 | 111 | 108 |
| Average cluster RMSD | 1.5 | 1.6 | 1.5 | 1.6 | 1.7 | 1.7 | 1.7 | 1.5 | 1.6 | 1.5 | 1.5 | 1.6 |
| # | 1 | 2 | 3 | 4 | 5 | 6 | 7 | 8 | 9 | 10 | 11 | 12 |
| RMSD | 4.30 | 4.61 | 4.04 | 4.27 | 4.55 | 4.38 | 4.67 | 5.75 | 4.55 | 5.01 | 5.03 | 5.43 |
| GDT_TS | 0.52 | 0.50 | 0.51 | 0.52 | 0.52 | 0.51 | 0.48 | 0.44 | 0.50 | 0.47 | 0.49 | 0.46 |
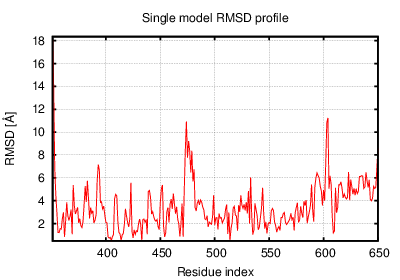
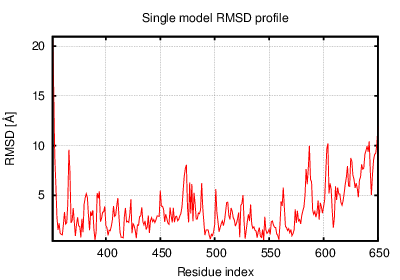
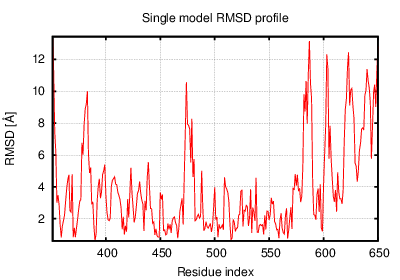
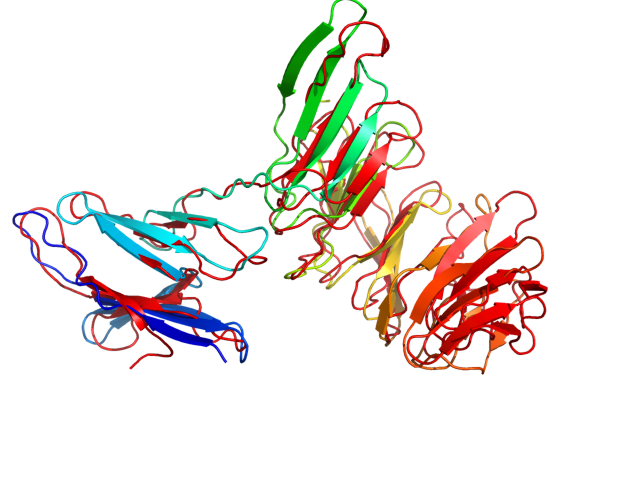
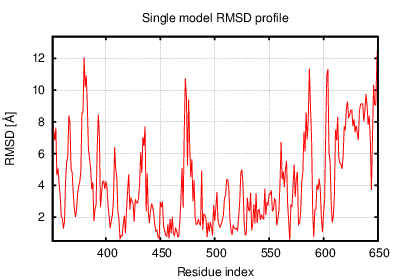
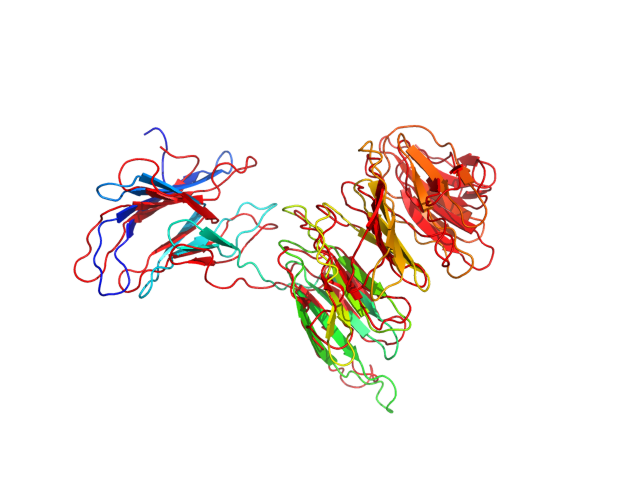
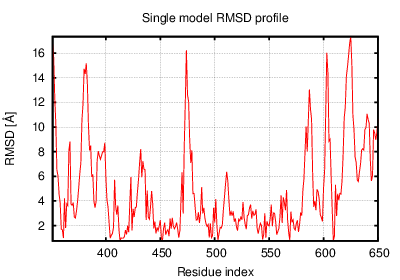
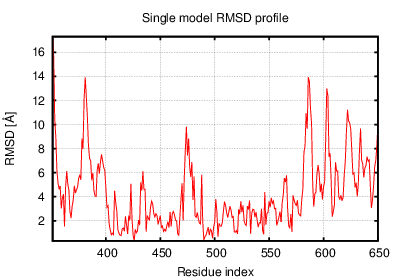
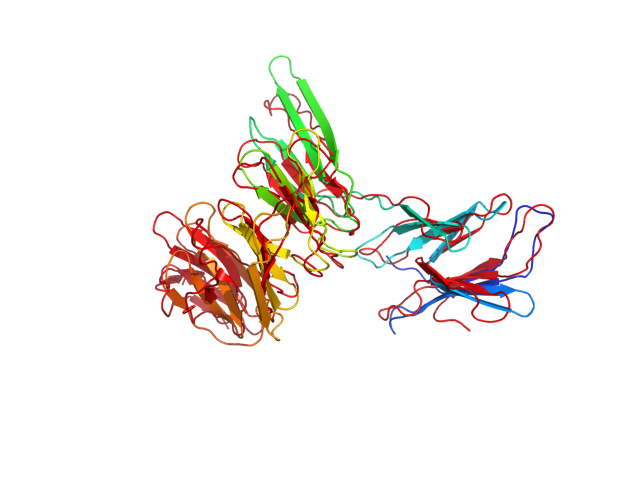
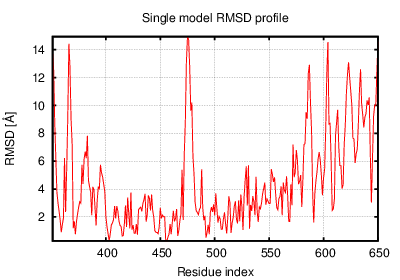
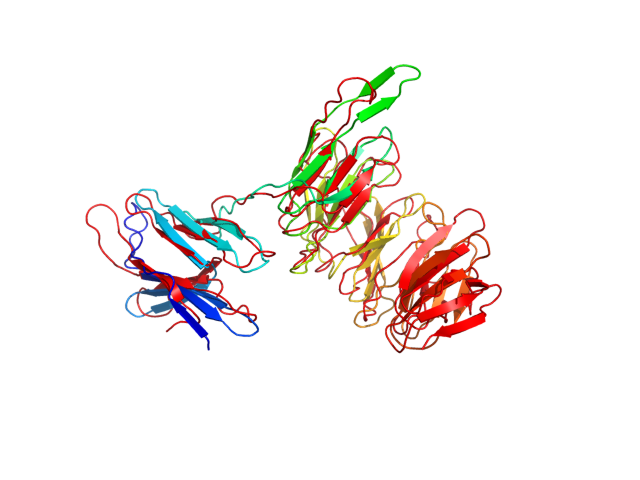
The table contains RMSD and GDT_TS values (calculated on the Cα atoms) between the predicted models and the input structure. Note that GDT_TS metric is intended as a more accurate measurement than the more common RMSD.
Read more about the root-mean-square deviation (RMSD) measure
Read more about the global distance test (GDT, also written as GDT_TS to represent "total score") measure.
| # | 1 | 2 | 3 | 4 | 5 | 6 | 7 | 8 | 9 | 10 | 11 | 12 |
| 1 | 0.00 | 2.62 | 2.75 | 2.61 | 2.87 | 3.38 | 3.52 | 3.83 | 2.41 | 3.23 | 3.23 | 3.40 |
| 2 | 2.62 | 0.00 | 3.02 | 2.84 | 3.03 | 3.88 | 3.41 | 3.64 | 2.55 | 3.21 | 3.65 | 2.97 |
| 3 | 2.75 | 3.02 | 0.00 | 2.95 | 3.40 | 3.86 | 3.88 | 4.35 | 2.68 | 3.79 | 3.42 | 3.93 |
| 4 | 2.61 | 2.84 | 2.95 | 0.00 | 3.07 | 2.84 | 3.66 | 4.11 | 2.59 | 3.68 | 2.88 | 3.79 |
| 5 | 2.87 | 3.03 | 3.40 | 3.07 | 0.00 | 4.02 | 2.84 | 3.35 | 2.75 | 3.01 | 3.76 | 2.81 |
| 6 | 3.38 | 3.88 | 3.86 | 2.84 | 4.02 | 0.00 | 4.50 | 5.29 | 3.90 | 4.58 | 3.76 | 4.87 |
| 7 | 3.52 | 3.41 | 3.88 | 3.66 | 2.84 | 4.50 | 0.00 | 3.04 | 3.51 | 2.81 | 4.19 | 3.46 |
| 8 | 3.83 | 3.64 | 4.35 | 4.11 | 3.35 | 5.29 | 3.04 | 0.00 | 3.35 | 2.78 | 4.30 | 3.37 |
| 9 | 2.41 | 2.55 | 2.68 | 2.59 | 2.75 | 3.90 | 3.51 | 3.35 | 0.00 | 3.21 | 2.87 | 3.15 |
| 10 | 3.23 | 3.21 | 3.79 | 3.68 | 3.01 | 4.58 | 2.81 | 2.78 | 3.21 | 0.00 | 3.91 | 3.15 |
| 11 | 3.23 | 3.65 | 3.42 | 2.88 | 3.76 | 3.76 | 4.19 | 4.30 | 2.87 | 3.91 | 0.00 | 4.46 |
| 12 | 3.40 | 2.97 | 3.93 | 3.79 | 2.81 | 4.87 | 3.46 | 3.37 | 3.15 | 3.15 | 4.46 | 0.00 |
The table contains RMSD values (calculated on the Cα atoms) between the predicted models.
Read more about the root-mean-square deviation (RMSD) measure.
| # | 1 | 2 | 3 | 4 | 5 | 6 | 7 | 8 | 9 | 10 | 11 | 12 |
| 1 | 1.00 | 0.68 | 0.61 | 0.65 | 0.65 | 0.58 | 0.60 | 0.55 | 0.67 | 0.60 | 0.57 | 0.59 |
| 2 | 0.68 | 1.00 | 0.63 | 0.70 | 0.60 | 0.56 | 0.60 | 0.57 | 0.70 | 0.59 | 0.58 | 0.60 |
| 3 | 0.61 | 0.63 | 1.00 | 0.62 | 0.59 | 0.53 | 0.55 | 0.50 | 0.64 | 0.57 | 0.58 | 0.54 |
| 4 | 0.65 | 0.70 | 0.62 | 1.00 | 0.62 | 0.63 | 0.58 | 0.56 | 0.68 | 0.55 | 0.66 | 0.56 |
| 5 | 0.65 | 0.60 | 0.59 | 0.62 | 1.00 | 0.55 | 0.65 | 0.60 | 0.65 | 0.62 | 0.60 | 0.64 |
| 6 | 0.58 | 0.56 | 0.53 | 0.63 | 0.55 | 1.00 | 0.51 | 0.47 | 0.55 | 0.49 | 0.55 | 0.47 |
| 7 | 0.60 | 0.60 | 0.55 | 0.58 | 0.65 | 0.51 | 1.00 | 0.61 | 0.58 | 0.65 | 0.58 | 0.57 |
| 8 | 0.55 | 0.57 | 0.50 | 0.56 | 0.60 | 0.47 | 0.61 | 1.00 | 0.60 | 0.65 | 0.56 | 0.58 |
| 9 | 0.67 | 0.70 | 0.64 | 0.68 | 0.65 | 0.55 | 0.58 | 0.60 | 1.00 | 0.60 | 0.66 | 0.60 |
| 10 | 0.60 | 0.59 | 0.57 | 0.55 | 0.62 | 0.49 | 0.65 | 0.65 | 0.60 | 1.00 | 0.54 | 0.62 |
| 11 | 0.57 | 0.58 | 0.58 | 0.66 | 0.60 | 0.55 | 0.58 | 0.56 | 0.66 | 0.54 | 1.00 | 0.52 |
| 12 | 0.59 | 0.60 | 0.54 | 0.56 | 0.64 | 0.47 | 0.57 | 0.58 | 0.60 | 0.62 | 0.52 | 1.00 |
The table contains GDT_TS values (calculated on the Cα atoms) between the predicted models.
Read more about the global distance test (GDT, also written as GDT_TS to represent "total score") measure.
© Laboratory of Theory of Biopolymers, Faculty of Chemistry, University of Warsaw 2013