Status: Done started: 2018-Feb-14 02:46:21 UTC
| Project Name | A |
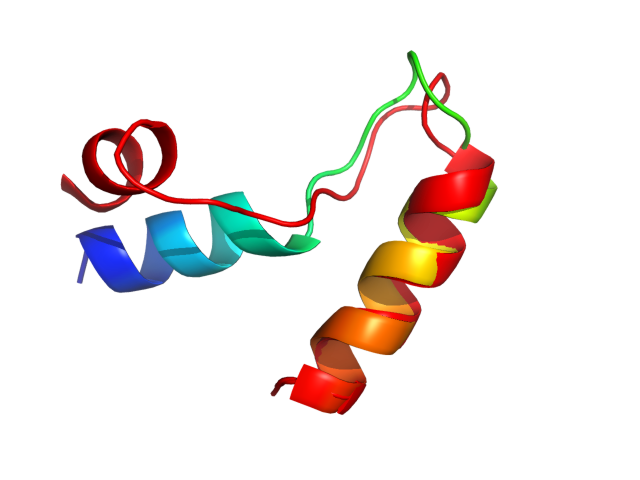
| Sequence | DVAARLRAAG FGAVGAGATA EETRRMLHRA FDTL |
| Secondary structure | CHHHHCCCCC CCCCCCCCCH HHHHHHHHHH HCCC |
| Movie from predicted structures | To download the movie, right click on the desired file format:  
|
| Estimated finish time | 2018-Feb-14 06:09 UTC |
| Project Name | A |
| Project Name | A |
| Cluster # | 1 | 2 | 3 | 4 | 5 | 6 | 7 | 8 | 9 | 10 | 11 | 12 |
| Cluster density | 331.5 | 329.5 | 218.3 | 157.0 | 140.1 | 120.8 | 112.6 | 92.7 | 81.1 | 39.0 | 35.4 | 30.0 |
| Cluster size | 383 | 306 | 241 | 150 | 232 | 143 | 140 | 134 | 124 | 56 | 48 | 43 |
| Average cluster RMSD | 1.2 | 0.9 | 1.1 | 1.0 | 1.7 | 1.2 | 1.2 | 1.4 | 1.5 | 1.4 | 1.4 | 1.4 |
| # | 1 | 2 | 3 | 4 | 5 | 6 | 7 | 8 | 9 | 10 | 11 | 12 |
| RMSD | 5.35 | 5.30 | 5.56 | 5.60 | 5.77 | 5.50 | 4.77 | 5.24 | 5.50 | 5.50 | 4.66 | 4.16 |
| GDT_TS | 0.59 | 0.61 | 0.54 | 0.55 | 0.54 | 0.62 | 0.59 | 0.62 | 0.56 | 0.61 | 0.62 | 0.61 |
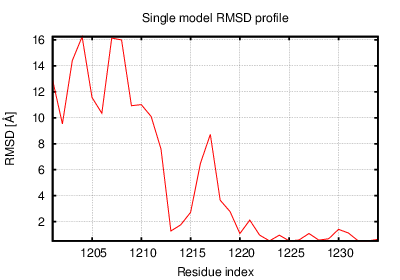
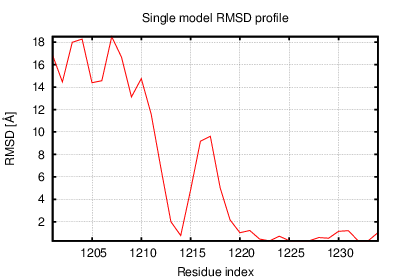
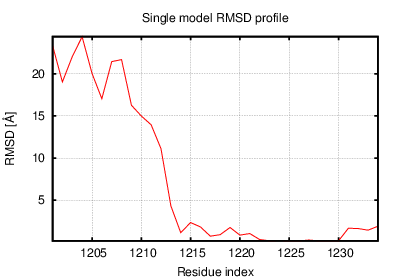
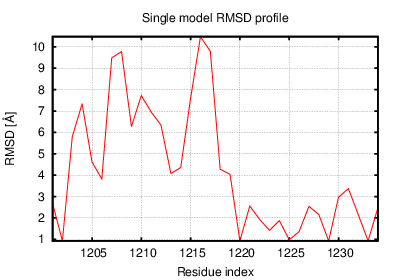
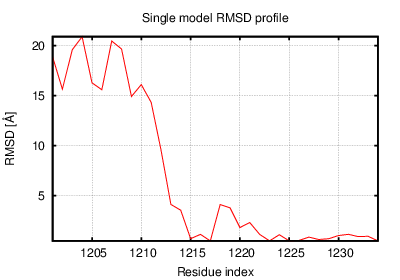
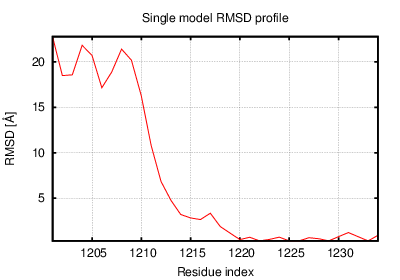
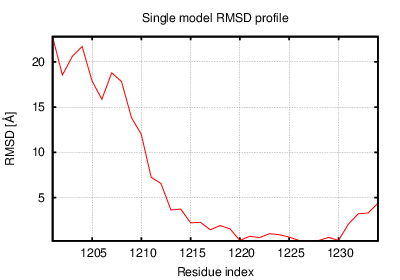
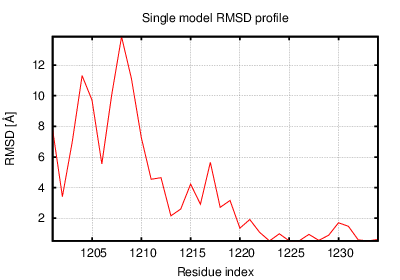
The table contains RMSD and GDT_TS values (calculated on the Cα atoms) between the predicted models and the input structure. Note that GDT_TS metric is intended as a more accurate measurement than the more common RMSD.
Read more about the root-mean-square deviation (RMSD) measure
Read more about the global distance test (GDT, also written as GDT_TS to represent "total score") measure.
| # | 1 | 2 | 3 | 4 | 5 | 6 | 7 | 8 | 9 | 10 | 11 | 12 |
| 1 | 0.00 | 1.08 | 1.10 | 1.41 | 3.93 | 2.70 | 1.64 | 2.37 | 1.98 | 4.08 | 3.63 | 3.68 |
| 2 | 1.08 | 0.00 | 0.73 | 1.75 | 3.52 | 2.38 | 1.54 | 2.15 | 1.83 | 4.00 | 3.35 | 3.37 |
| 3 | 1.10 | 0.73 | 0.00 | 1.51 | 3.50 | 2.14 | 1.67 | 2.08 | 1.70 | 4.08 | 3.29 | 3.73 |
| 4 | 1.41 | 1.75 | 1.51 | 0.00 | 3.86 | 2.55 | 2.07 | 2.10 | 2.04 | 4.23 | 3.81 | 4.15 |
| 5 | 3.93 | 3.52 | 3.50 | 3.86 | 0.00 | 3.21 | 3.99 | 3.14 | 3.51 | 2.89 | 3.33 | 3.21 |
| 6 | 2.70 | 2.38 | 2.14 | 2.55 | 3.21 | 0.00 | 2.68 | 1.69 | 1.59 | 4.14 | 2.57 | 4.18 |
| 7 | 1.64 | 1.54 | 1.67 | 2.07 | 3.99 | 2.68 | 0.00 | 2.52 | 2.17 | 4.24 | 3.45 | 3.47 |
| 8 | 2.37 | 2.15 | 2.08 | 2.10 | 3.14 | 1.69 | 2.52 | 0.00 | 1.82 | 3.51 | 2.77 | 3.68 |
| 9 | 1.98 | 1.83 | 1.70 | 2.04 | 3.51 | 1.59 | 2.17 | 1.82 | 0.00 | 4.09 | 3.11 | 3.85 |
| 10 | 4.08 | 4.00 | 4.08 | 4.23 | 2.89 | 4.14 | 4.24 | 3.51 | 4.09 | 0.00 | 3.42 | 2.88 |
| 11 | 3.63 | 3.35 | 3.29 | 3.81 | 3.33 | 2.57 | 3.45 | 2.77 | 3.11 | 3.42 | 0.00 | 3.70 |
| 12 | 3.68 | 3.37 | 3.73 | 4.15 | 3.21 | 4.18 | 3.47 | 3.68 | 3.85 | 2.88 | 3.70 | 0.00 |
The table contains RMSD values (calculated on the Cα atoms) between the predicted models.
Read more about the root-mean-square deviation (RMSD) measure.
| # | 1 | 2 | 3 | 4 | 5 | 6 | 7 | 8 | 9 | 10 | 11 | 12 |
| 1 | 1.00 | 0.93 | 0.91 | 0.84 | 0.63 | 0.73 | 0.87 | 0.77 | 0.82 | 0.62 | 0.68 | 0.65 |
| 2 | 0.93 | 1.00 | 0.97 | 0.80 | 0.68 | 0.78 | 0.84 | 0.80 | 0.82 | 0.62 | 0.71 | 0.70 |
| 3 | 0.91 | 0.97 | 1.00 | 0.83 | 0.68 | 0.83 | 0.84 | 0.82 | 0.88 | 0.62 | 0.74 | 0.66 |
| 4 | 0.84 | 0.80 | 0.83 | 1.00 | 0.66 | 0.78 | 0.80 | 0.87 | 0.82 | 0.62 | 0.70 | 0.68 |
| 5 | 0.63 | 0.68 | 0.68 | 0.66 | 1.00 | 0.70 | 0.65 | 0.70 | 0.66 | 0.74 | 0.72 | 0.73 |
| 6 | 0.73 | 0.78 | 0.83 | 0.78 | 0.70 | 1.00 | 0.76 | 0.82 | 0.85 | 0.68 | 0.74 | 0.66 |
| 7 | 0.87 | 0.84 | 0.84 | 0.80 | 0.65 | 0.76 | 1.00 | 0.77 | 0.76 | 0.62 | 0.69 | 0.70 |
| 8 | 0.77 | 0.80 | 0.82 | 0.87 | 0.70 | 0.82 | 0.77 | 1.00 | 0.83 | 0.66 | 0.76 | 0.68 |
| 9 | 0.82 | 0.82 | 0.88 | 0.82 | 0.66 | 0.85 | 0.76 | 0.83 | 1.00 | 0.62 | 0.72 | 0.66 |
| 10 | 0.62 | 0.62 | 0.62 | 0.62 | 0.74 | 0.68 | 0.62 | 0.66 | 0.62 | 1.00 | 0.71 | 0.71 |
| 11 | 0.68 | 0.71 | 0.74 | 0.70 | 0.72 | 0.74 | 0.69 | 0.76 | 0.72 | 0.71 | 1.00 | 0.72 |
| 12 | 0.65 | 0.70 | 0.66 | 0.68 | 0.73 | 0.66 | 0.70 | 0.68 | 0.66 | 0.71 | 0.72 | 1.00 |
The table contains GDT_TS values (calculated on the Cα atoms) between the predicted models.
Read more about the global distance test (GDT, also written as GDT_TS to represent "total score") measure.
© Laboratory of Theory of Biopolymers, Faculty of Chemistry, University of Warsaw 2013