Status: Done started: 2018-Sep-24 08:52:37 UTC
| Project Name | |
| Sequence | NLYFQHMRHF ARTHAIGQIV PGKVTKLVPF GAFVRVEEGI EGLVHIFELA ERHVEVPDQV VAVGDDAMVK VIDIDLERRR ISLSLKQANE DYTEEFDPAK YGMADSYDEQ GNYIFPEGFD AETNEWLEGF EKQRAEWEAR YAEAERRHKM HTAQMEKFAA A |
| Secondary structure | CCCHHHHHHH HCCCCCCCEE EEEEEEEECC EEEEEECCCE EEEEECCCCC CCCCCCCCCC CCCCCEEEEE EEEEECCCCE EEEEHHHHHH CCCCCCCCCC CCCCCCCCCC CCCCCCCCEE CCCCEECCCC HHHHHHHHHH HHHHHHHHHH HHHHHHHHHC C |
| Movie from predicted structures | To download the movie, right click on the desired file format:  
|
| Estimated finish time | 2018-Sep-24 13:32 UTC |
| Project Name |
| Project Name |
| Cluster # | 1 | 2 | 3 | 4 | 5 | 6 | 7 | 8 | 9 | 10 | 11 | 12 |
| Cluster density | 204.3 | 165.5 | 127.2 | 126.8 | 106.7 | 104.0 | 88.5 | 83.8 | 79.3 | 78.2 | 75.5 | 43.3 |
| Cluster size | 320 | 246 | 241 | 202 | 163 | 169 | 125 | 135 | 121 | 109 | 108 | 61 |
| Average cluster RMSD | 1.6 | 1.5 | 1.9 | 1.6 | 1.5 | 1.6 | 1.4 | 1.6 | 1.5 | 1.4 | 1.4 | 1.4 |
| # | 1 | 2 | 3 | 4 | 5 | 6 | 7 | 8 | 9 | 10 | 11 | 12 |
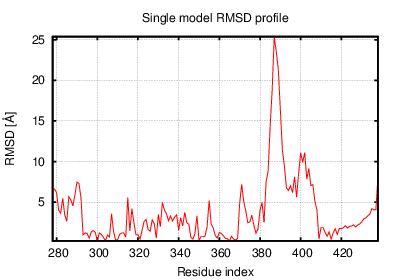
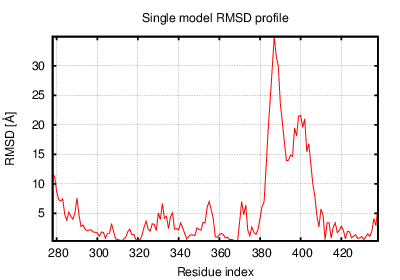
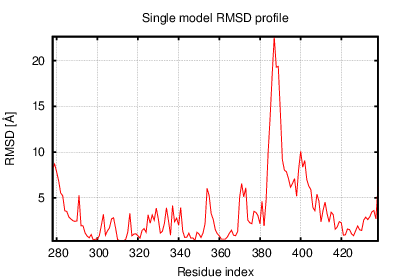
| RMSD | 6.37 | 7.26 | 5.30 | 5.14 | 5.42 | 5.26 | 7.89 | 4.51 | 6.21 | 5.36 | 5.47 | 6.15 |
| GDT_TS | 0.60 | 0.56 | 0.60 | 0.60 | 0.62 | 0.60 | 0.53 | 0.61 | 0.59 | 0.58 | 0.59 | 0.60 |
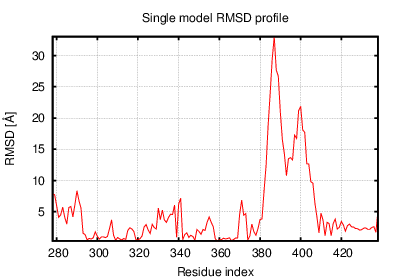
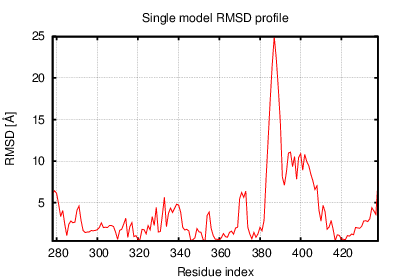
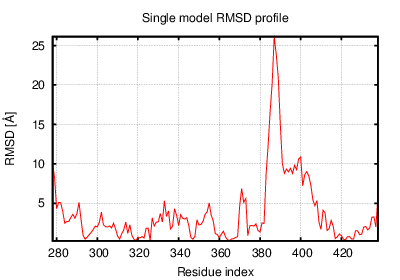
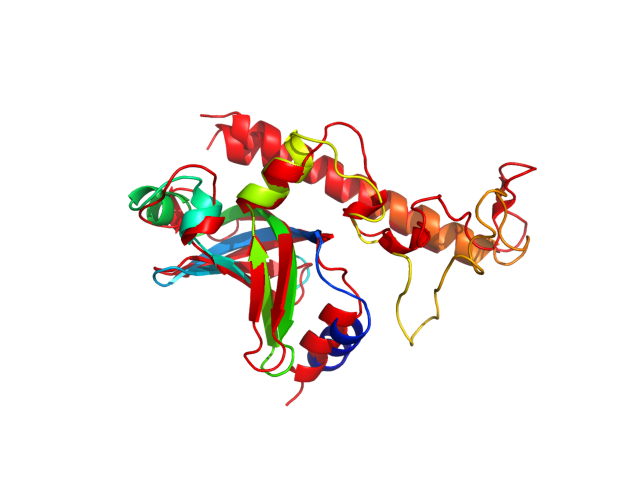
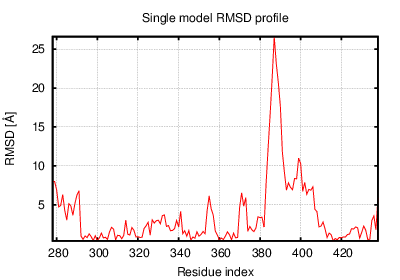
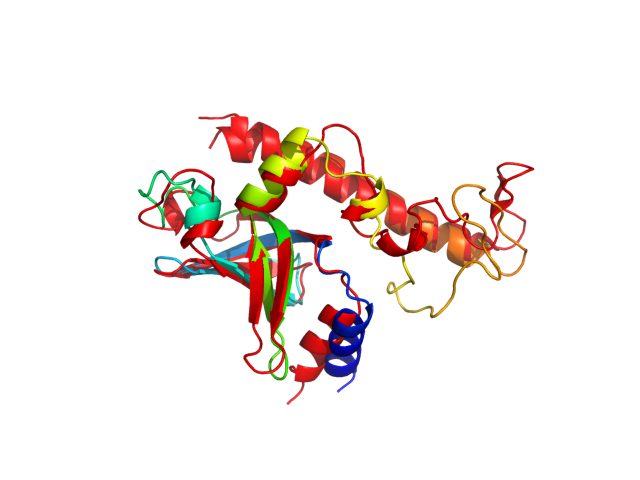
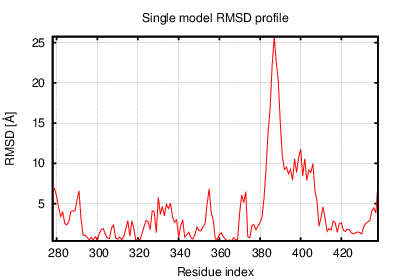
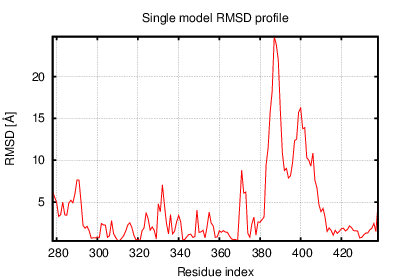
The table contains RMSD and GDT_TS values (calculated on the Cα atoms) between the predicted models and the input structure. Note that GDT_TS metric is intended as a more accurate measurement than the more common RMSD.
Read more about the root-mean-square deviation (RMSD) measure
Read more about the global distance test (GDT, also written as GDT_TS to represent "total score") measure.
| # | 1 | 2 | 3 | 4 | 5 | 6 | 7 | 8 | 9 | 10 | 11 | 12 |
| 1 | 0.00 | 2.70 | 3.08 | 3.33 | 2.72 | 2.87 | 3.19 | 4.24 | 2.50 | 2.79 | 3.27 | 2.41 |
| 2 | 2.70 | 0.00 | 4.29 | 4.59 | 3.98 | 3.45 | 2.29 | 5.37 | 2.75 | 3.91 | 3.64 | 3.69 |
| 3 | 3.08 | 4.29 | 0.00 | 1.75 | 2.42 | 2.63 | 5.05 | 2.78 | 3.11 | 2.33 | 2.65 | 3.18 |
| 4 | 3.33 | 4.59 | 1.75 | 0.00 | 2.40 | 2.75 | 5.27 | 2.61 | 3.26 | 2.12 | 2.73 | 3.39 |
| 5 | 2.72 | 3.98 | 2.42 | 2.40 | 0.00 | 2.44 | 4.49 | 3.26 | 3.05 | 2.47 | 2.70 | 2.88 |
| 6 | 2.87 | 3.45 | 2.63 | 2.75 | 2.44 | 0.00 | 4.26 | 3.16 | 2.66 | 2.36 | 2.19 | 3.24 |
| 7 | 3.19 | 2.29 | 5.05 | 5.27 | 4.49 | 4.26 | 0.00 | 6.07 | 3.55 | 4.60 | 4.41 | 4.22 |
| 8 | 4.24 | 5.37 | 2.78 | 2.61 | 3.26 | 3.16 | 6.07 | 0.00 | 3.96 | 3.14 | 3.25 | 4.30 |
| 9 | 2.50 | 2.75 | 3.11 | 3.26 | 3.05 | 2.66 | 3.55 | 3.96 | 0.00 | 3.09 | 3.01 | 2.99 |
| 10 | 2.79 | 3.91 | 2.33 | 2.12 | 2.47 | 2.36 | 4.60 | 3.14 | 3.09 | 0.00 | 2.42 | 2.99 |
| 11 | 3.27 | 3.64 | 2.65 | 2.73 | 2.70 | 2.19 | 4.41 | 3.25 | 3.01 | 2.42 | 0.00 | 3.33 |
| 12 | 2.41 | 3.69 | 3.18 | 3.39 | 2.88 | 3.24 | 4.22 | 4.30 | 2.99 | 2.99 | 3.33 | 0.00 |
The table contains RMSD values (calculated on the Cα atoms) between the predicted models.
Read more about the root-mean-square deviation (RMSD) measure.
| # | 1 | 2 | 3 | 4 | 5 | 6 | 7 | 8 | 9 | 10 | 11 | 12 |
| 1 | 1.00 | 0.72 | 0.65 | 0.67 | 0.69 | 0.70 | 0.69 | 0.65 | 0.71 | 0.74 | 0.67 | 0.73 |
| 2 | 0.72 | 1.00 | 0.59 | 0.61 | 0.67 | 0.70 | 0.75 | 0.53 | 0.68 | 0.69 | 0.68 | 0.66 |
| 3 | 0.65 | 0.59 | 1.00 | 0.83 | 0.71 | 0.68 | 0.56 | 0.72 | 0.68 | 0.73 | 0.67 | 0.63 |
| 4 | 0.67 | 0.61 | 0.83 | 1.00 | 0.73 | 0.67 | 0.56 | 0.70 | 0.68 | 0.75 | 0.68 | 0.64 |
| 5 | 0.69 | 0.67 | 0.71 | 0.73 | 1.00 | 0.72 | 0.63 | 0.66 | 0.71 | 0.70 | 0.74 | 0.69 |
| 6 | 0.70 | 0.70 | 0.68 | 0.67 | 0.72 | 1.00 | 0.61 | 0.62 | 0.73 | 0.74 | 0.75 | 0.67 |
| 7 | 0.69 | 0.75 | 0.56 | 0.56 | 0.63 | 0.61 | 1.00 | 0.55 | 0.63 | 0.64 | 0.64 | 0.62 |
| 8 | 0.65 | 0.53 | 0.72 | 0.70 | 0.66 | 0.62 | 0.55 | 1.00 | 0.63 | 0.65 | 0.63 | 0.61 |
| 9 | 0.71 | 0.68 | 0.68 | 0.68 | 0.71 | 0.73 | 0.63 | 0.63 | 1.00 | 0.69 | 0.71 | 0.70 |
| 10 | 0.74 | 0.69 | 0.73 | 0.75 | 0.70 | 0.74 | 0.64 | 0.65 | 0.69 | 1.00 | 0.71 | 0.67 |
| 11 | 0.67 | 0.68 | 0.67 | 0.68 | 0.74 | 0.75 | 0.64 | 0.63 | 0.71 | 0.71 | 1.00 | 0.68 |
| 12 | 0.73 | 0.66 | 0.63 | 0.64 | 0.69 | 0.67 | 0.62 | 0.61 | 0.70 | 0.67 | 0.68 | 1.00 |
The table contains GDT_TS values (calculated on the Cα atoms) between the predicted models.
Read more about the global distance test (GDT, also written as GDT_TS to represent "total score") measure.
© Laboratory of Theory of Biopolymers, Faculty of Chemistry, University of Warsaw 2013