Status: Done started: 2018-Aug-30 14:27:01 UTC
| Project Name | |
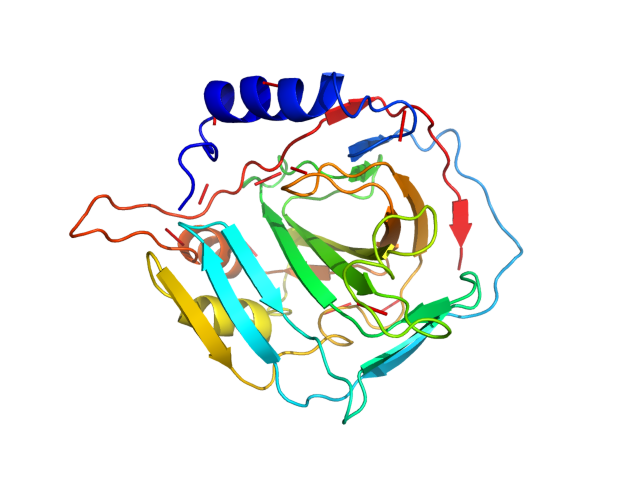
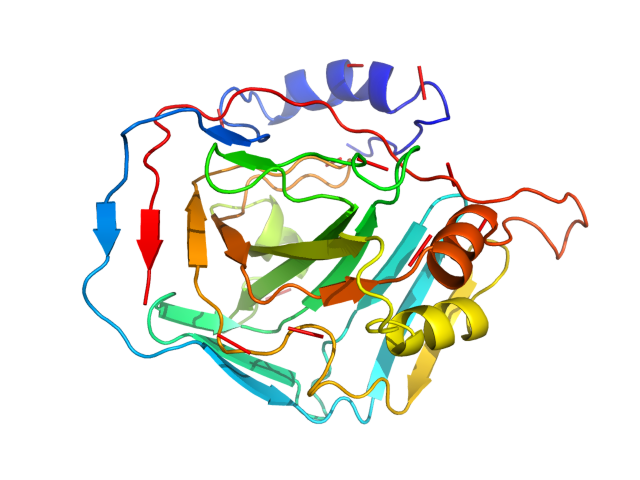
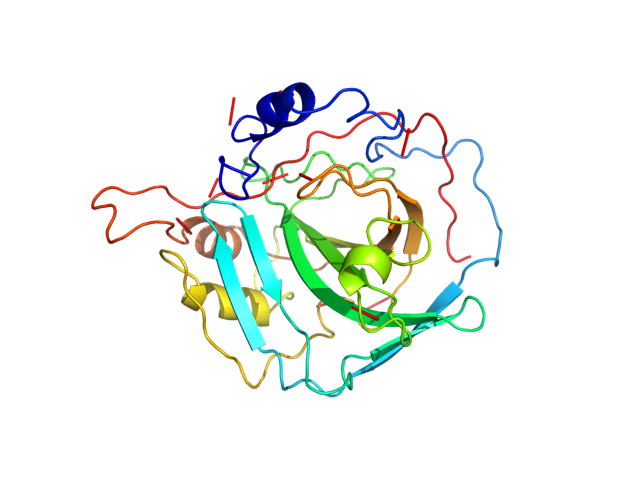
| Sequence | ASPDWGYDDK NGPEQWSKLY PIANGNNQSP VDIKTSETKH DTSLKPISVS YNPATAKEII NVGHSFHVNF EDNDNRSVLK GGPFSDSYRL FQFHFHWGST NEHGSEHTVD GVKYSAELHV AHWNSAKYSS LAEAASKADG LAVIGVLMKV GEANPKLQKV LDALQAIKTK GKRAPFTNFD PSTLLPSSLD FWTYPGSLTH PPLYESVTWI ICKESISVSS EQLAQFRSLL SNVEGDNAVP MQHNNRPTQP LKGRTVRASF |
| Secondary structure | CCCCCCCCCC CCCCCHHHHC CCCCCCCCCC CEECCCCCEE CCCCCCEEEE CCCCCEEEEE ECCCCEEEEE CCCCCCCEEE ECCCCCCEEE EEEEEEECCC CCCCCCCEEC CEECCEEEEE EEECCCCCCC HHHHCCCCCC EEEEEEEEEE CCCCCCCHHH HHHCCCCCCC CCEEECCCCC CCCCCCCCCC EEEEEECCCC CCCCCCEEEE EECCCEEECH HHHHHHHCCC CCCCCCCCCC CCCCCCCCCC CCCCCCEECC |
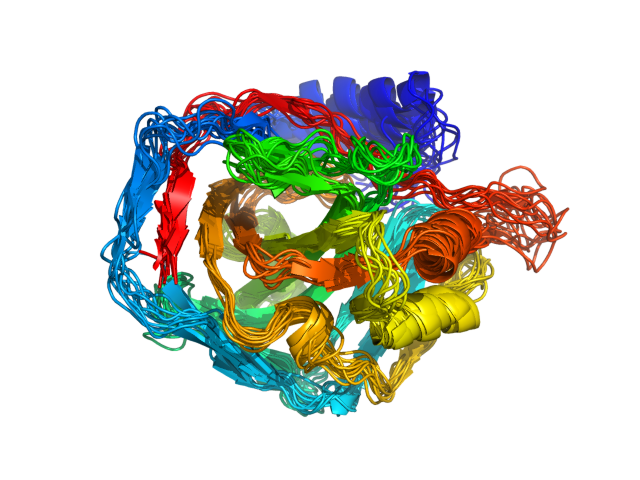
| Movie from predicted structures | To download the movie, right click on the desired file format:  
|
| Estimated finish time | 2018-Aug-30 19:20 UTC |
| Project Name |

| Project Name |
| Cluster # | 1 | 2 | 3 | 4 | 5 | 6 | 7 | 8 | 9 | 10 | 11 | 12 |
| Cluster density | 180.0 | 163.1 | 147.1 | 142.0 | 133.4 | 129.2 | 129.1 | 107.2 | 95.1 | 90.3 | 49.1 | 48.5 |
| Cluster size | 252 | 242 | 211 | 204 | 188 | 178 | 189 | 143 | 132 | 118 | 70 | 73 |
| Average cluster RMSD | 1.4 | 1.5 | 1.4 | 1.4 | 1.4 | 1.4 | 1.5 | 1.3 | 1.4 | 1.3 | 1.4 | 1.5 |
| # | 1 | 2 | 3 | 4 | 5 | 6 | 7 | 8 | 9 | 10 | 11 | 12 |
| RMSD | 2.94 | 2.79 | 2.76 | 2.60 | 2.81 | 3.16 | 2.66 | 2.88 | 2.73 | 2.66 | 2.75 | 2.59 |
| GDT_TS | 0.64 | 0.62 | 0.65 | 0.67 | 0.63 | 0.59 | 0.65 | 0.62 | 0.66 | 0.65 | 0.67 | 0.65 |
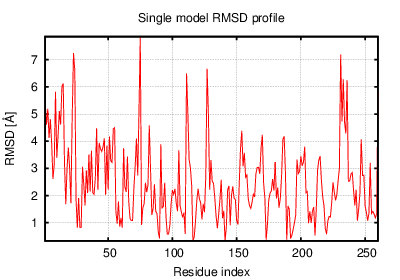
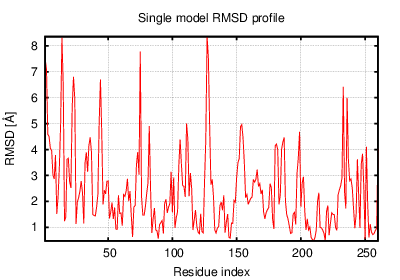
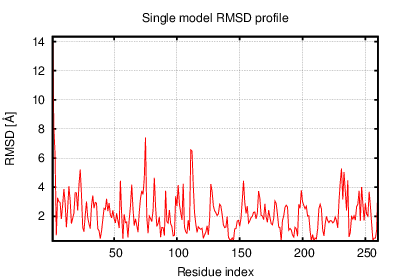
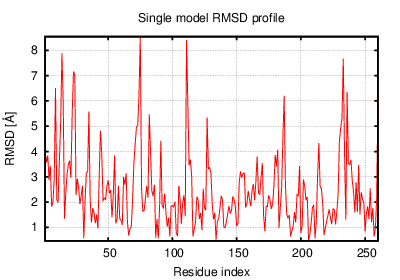
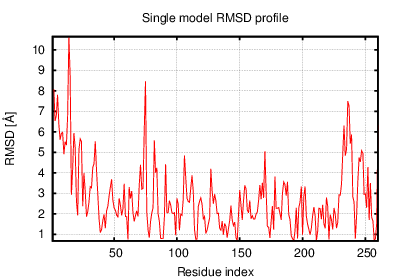
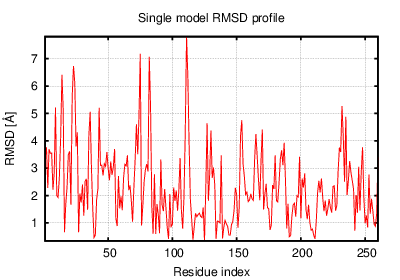
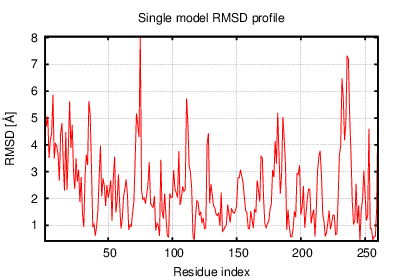
The table contains RMSD and GDT_TS values (calculated on the Cα atoms) between the predicted models and the input structure. Note that GDT_TS metric is intended as a more accurate measurement than the more common RMSD.
Read more about the root-mean-square deviation (RMSD) measure
Read more about the global distance test (GDT, also written as GDT_TS to represent "total score") measure.
| # | 1 | 2 | 3 | 4 | 5 | 6 | 7 | 8 | 9 | 10 | 11 | 12 |
| 1 | 0.00 | 2.30 | 2.46 | 2.34 | 2.26 | 2.50 | 2.28 | 2.54 | 2.60 | 2.18 | 2.70 | 2.71 |
| 2 | 2.30 | 0.00 | 2.33 | 2.42 | 1.98 | 2.36 | 2.09 | 2.37 | 2.67 | 2.31 | 2.75 | 2.47 |
| 3 | 2.46 | 2.33 | 0.00 | 2.31 | 2.19 | 2.59 | 2.06 | 2.63 | 2.31 | 2.32 | 2.87 | 2.56 |
| 4 | 2.34 | 2.42 | 2.31 | 0.00 | 2.46 | 2.81 | 2.21 | 2.44 | 2.42 | 2.17 | 2.63 | 2.54 |
| 5 | 2.26 | 1.98 | 2.19 | 2.46 | 0.00 | 2.27 | 1.89 | 2.22 | 2.59 | 1.99 | 2.82 | 2.49 |
| 6 | 2.50 | 2.36 | 2.59 | 2.81 | 2.27 | 0.00 | 2.41 | 2.59 | 3.26 | 2.54 | 2.89 | 2.61 |
| 7 | 2.28 | 2.09 | 2.06 | 2.21 | 1.89 | 2.41 | 0.00 | 2.25 | 2.24 | 2.18 | 2.59 | 2.30 |
| 8 | 2.54 | 2.37 | 2.63 | 2.44 | 2.22 | 2.59 | 2.25 | 0.00 | 2.57 | 2.13 | 2.53 | 2.61 |
| 9 | 2.60 | 2.67 | 2.31 | 2.42 | 2.59 | 3.26 | 2.24 | 2.57 | 0.00 | 2.30 | 2.73 | 2.62 |
| 10 | 2.18 | 2.31 | 2.32 | 2.17 | 1.99 | 2.54 | 2.18 | 2.13 | 2.30 | 0.00 | 2.58 | 2.61 |
| 11 | 2.70 | 2.75 | 2.87 | 2.63 | 2.82 | 2.89 | 2.59 | 2.53 | 2.73 | 2.58 | 0.00 | 2.42 |
| 12 | 2.71 | 2.47 | 2.56 | 2.54 | 2.49 | 2.61 | 2.30 | 2.61 | 2.62 | 2.61 | 2.42 | 0.00 |
The table contains RMSD values (calculated on the Cα atoms) between the predicted models.
Read more about the root-mean-square deviation (RMSD) measure.
| # | 1 | 2 | 3 | 4 | 5 | 6 | 7 | 8 | 9 | 10 | 11 | 12 |
| 1 | 1.00 | 0.71 | 0.72 | 0.75 | 0.72 | 0.71 | 0.72 | 0.71 | 0.71 | 0.72 | 0.70 | 0.70 |
| 2 | 0.71 | 1.00 | 0.70 | 0.71 | 0.76 | 0.71 | 0.75 | 0.75 | 0.70 | 0.73 | 0.69 | 0.72 |
| 3 | 0.72 | 0.70 | 1.00 | 0.71 | 0.73 | 0.70 | 0.75 | 0.70 | 0.76 | 0.72 | 0.68 | 0.71 |
| 4 | 0.75 | 0.71 | 0.71 | 1.00 | 0.71 | 0.72 | 0.76 | 0.72 | 0.72 | 0.73 | 0.69 | 0.70 |
| 5 | 0.72 | 0.76 | 0.73 | 0.71 | 1.00 | 0.72 | 0.77 | 0.76 | 0.71 | 0.78 | 0.69 | 0.71 |
| 6 | 0.71 | 0.71 | 0.70 | 0.72 | 0.72 | 1.00 | 0.73 | 0.69 | 0.67 | 0.71 | 0.69 | 0.71 |
| 7 | 0.72 | 0.75 | 0.75 | 0.76 | 0.77 | 0.73 | 1.00 | 0.70 | 0.73 | 0.72 | 0.68 | 0.73 |
| 8 | 0.71 | 0.75 | 0.70 | 0.72 | 0.76 | 0.69 | 0.70 | 1.00 | 0.70 | 0.77 | 0.69 | 0.70 |
| 9 | 0.71 | 0.70 | 0.76 | 0.72 | 0.71 | 0.67 | 0.73 | 0.70 | 1.00 | 0.72 | 0.69 | 0.72 |
| 10 | 0.72 | 0.73 | 0.72 | 0.73 | 0.78 | 0.71 | 0.72 | 0.77 | 0.72 | 1.00 | 0.71 | 0.69 |
| 11 | 0.70 | 0.69 | 0.68 | 0.69 | 0.69 | 0.69 | 0.68 | 0.69 | 0.69 | 0.71 | 1.00 | 0.74 |
| 12 | 0.70 | 0.72 | 0.71 | 0.70 | 0.71 | 0.71 | 0.73 | 0.70 | 0.72 | 0.69 | 0.74 | 1.00 |
The table contains GDT_TS values (calculated on the Cα atoms) between the predicted models.
Read more about the global distance test (GDT, also written as GDT_TS to represent "total score") measure.
© Laboratory of Theory of Biopolymers, Faculty of Chemistry, University of Warsaw 2013