Status: Done started: 2018-Jan-12 10:40:53 UTC
| Project Name | MCM3 |
| Sequence | NTENDCPLSH EAYCLHDGVC MYIEALDKYA CNCVVGYVGE RCQFRDLRWW DARGGSGGTS GGGGGSGTPQ NITDLCAEYH NTQIHTLNDK IFSYTESLAD KREMAIITFK NGATFQVEVP GSQHIDSQKK AIERMKDTLR IAYLTEAKVE KLCVWNNKTP HAIAAISMAN GGSGGTSGGG GGSGNTENDC PLSHEAYCLH DGVCMYIEAL DKYACNCVVG YVGERCQFRD LRWWDAR |
| Secondary structure | CEECCCCCHH HHHCCCCCEE CCEECCCCCC EECCCCCCCC CCCCCCCCCC CCCCCCCCCC CCCCCCCCCC CHHHHHHHCC CEEEEEEEEC CCEEEEECCC CCEEEEECCC CCEECCCCCC CCCCHHHHHH HHHHHHHHHH HHHHCCCEEE EEEECCCCCC EEEEEEEEEC CCCCCCCCCC CCCCCCCCCC CCCCCCCCCC CCCEEEEEEC CEEEEEECCC CCCCCCCCCC CCCCCCC |
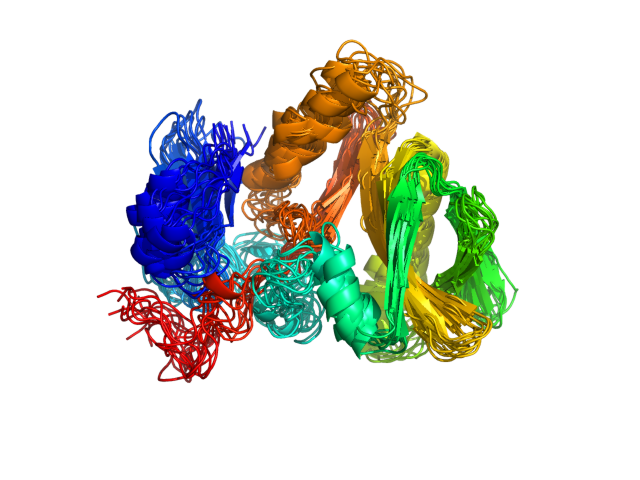
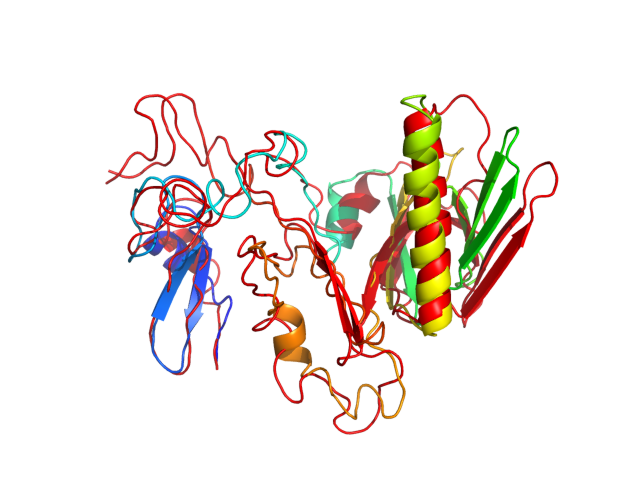
| Movie from predicted structures | To download the movie, right click on the desired file format:  
|
| Estimated finish time | 2018-Jan-12 14:31 UTC |
| Project Name | MCM3 |
| Project Name | MCM3 |
| Cluster # | 1 | 2 | 3 | 4 | 5 | 6 | 7 | 8 | 9 | 10 | 11 | 12 |
| Cluster density | 160.0 | 135.7 | 121.1 | 106.9 | 101.8 | 100.5 | 91.8 | 88.3 | 81.8 | 78.4 | 67.6 | 26.5 |
| Cluster size | 276 | 231 | 204 | 189 | 166 | 162 | 158 | 166 | 137 | 129 | 131 | 51 |
| Average cluster RMSD | 1.7 | 1.7 | 1.7 | 1.8 | 1.6 | 1.6 | 1.7 | 1.9 | 1.7 | 1.6 | 1.9 | 1.9 |
| # | 1 | 2 | 3 | 4 | 5 | 6 | 7 | 8 | 9 | 10 | 11 | 12 |
| RMSD | 4.90 | 7.24 | 7.22 | 6.33 | 5.67 | 5.78 | 5.58 | 6.80 | 5.62 | 5.06 | 5.65 | 4.46 |
| GDT_TS | 0.46 | 0.37 | 0.36 | 0.38 | 0.43 | 0.41 | 0.41 | 0.37 | 0.42 | 0.44 | 0.43 | 0.49 |
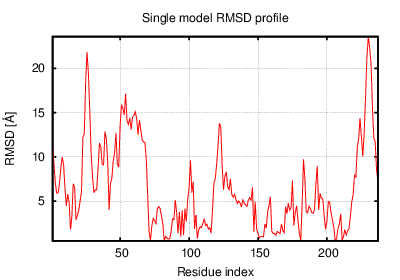
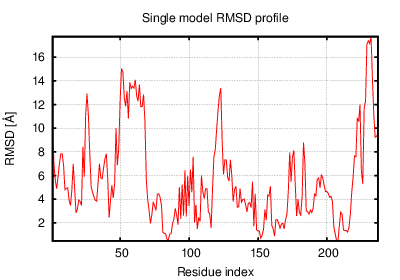
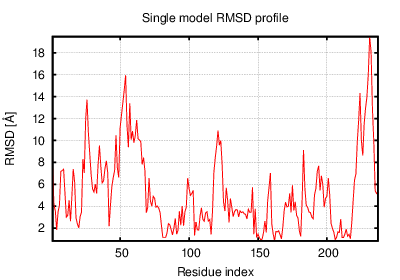
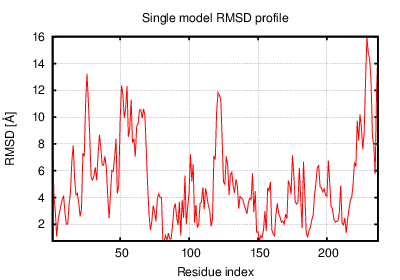
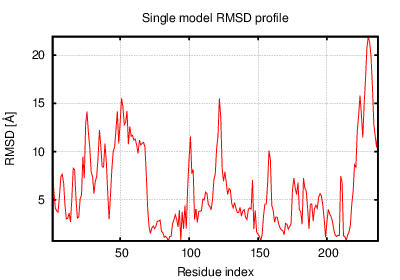
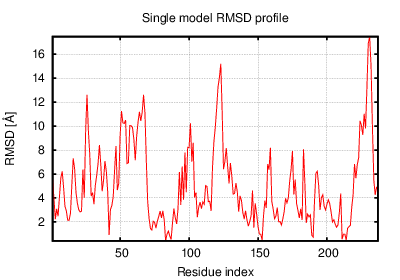
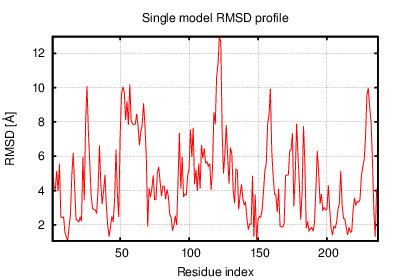
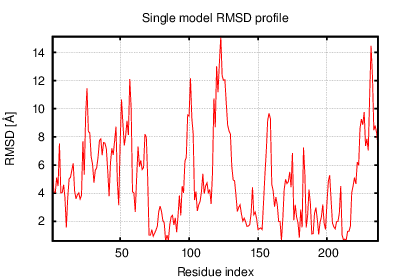
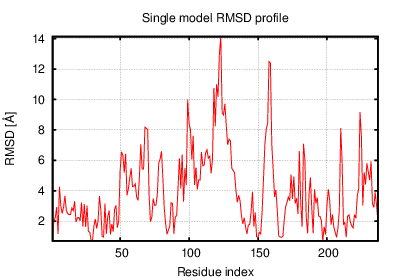
The table contains RMSD and GDT_TS values (calculated on the Cα atoms) between the predicted models and the input structure. Note that GDT_TS metric is intended as a more accurate measurement than the more common RMSD.
Read more about the root-mean-square deviation (RMSD) measure
Read more about the global distance test (GDT, also written as GDT_TS to represent "total score") measure.
| # | 1 | 2 | 3 | 4 | 5 | 6 | 7 | 8 | 9 | 10 | 11 | 12 |
| 1 | 0.00 | 4.47 | 4.29 | 3.73 | 2.90 | 3.10 | 2.88 | 4.09 | 2.71 | 2.73 | 3.11 | 3.75 |
| 2 | 4.47 | 0.00 | 2.93 | 3.40 | 4.45 | 3.56 | 4.38 | 3.12 | 3.54 | 4.48 | 4.68 | 5.54 |
| 3 | 4.29 | 2.93 | 0.00 | 3.29 | 4.18 | 3.91 | 4.08 | 3.32 | 3.71 | 4.22 | 4.74 | 5.56 |
| 4 | 3.73 | 3.40 | 3.29 | 0.00 | 3.64 | 3.12 | 3.29 | 3.59 | 2.80 | 3.64 | 4.50 | 4.85 |
| 5 | 2.90 | 4.45 | 4.18 | 3.64 | 0.00 | 3.32 | 3.35 | 4.16 | 2.93 | 3.07 | 2.79 | 3.82 |
| 6 | 3.10 | 3.56 | 3.91 | 3.12 | 3.32 | 0.00 | 2.97 | 3.68 | 2.65 | 3.17 | 3.90 | 4.63 |
| 7 | 2.88 | 4.38 | 4.08 | 3.29 | 3.35 | 2.97 | 0.00 | 4.03 | 2.58 | 2.85 | 3.95 | 4.41 |
| 8 | 4.09 | 3.12 | 3.32 | 3.59 | 4.16 | 3.68 | 4.03 | 0.00 | 3.62 | 4.08 | 4.12 | 4.92 |
| 9 | 2.71 | 3.54 | 3.71 | 2.80 | 2.93 | 2.65 | 2.58 | 3.62 | 0.00 | 2.76 | 3.47 | 4.13 |
| 10 | 2.73 | 4.48 | 4.22 | 3.64 | 3.07 | 3.17 | 2.85 | 4.08 | 2.76 | 0.00 | 3.52 | 3.88 |
| 11 | 3.11 | 4.68 | 4.74 | 4.50 | 2.79 | 3.90 | 3.95 | 4.12 | 3.47 | 3.52 | 0.00 | 3.47 |
| 12 | 3.75 | 5.54 | 5.56 | 4.85 | 3.82 | 4.63 | 4.41 | 4.92 | 4.13 | 3.88 | 3.47 | 0.00 |
The table contains RMSD values (calculated on the Cα atoms) between the predicted models.
Read more about the root-mean-square deviation (RMSD) measure.
| # | 1 | 2 | 3 | 4 | 5 | 6 | 7 | 8 | 9 | 10 | 11 | 12 |
| 1 | 1.00 | 0.56 | 0.54 | 0.59 | 0.66 | 0.65 | 0.66 | 0.57 | 0.71 | 0.66 | 0.62 | 0.57 |
| 2 | 0.56 | 1.00 | 0.64 | 0.63 | 0.54 | 0.60 | 0.53 | 0.63 | 0.60 | 0.54 | 0.52 | 0.45 |
| 3 | 0.54 | 0.64 | 1.00 | 0.62 | 0.56 | 0.56 | 0.54 | 0.63 | 0.57 | 0.55 | 0.52 | 0.47 |
| 4 | 0.59 | 0.63 | 0.62 | 1.00 | 0.58 | 0.62 | 0.62 | 0.60 | 0.67 | 0.58 | 0.51 | 0.48 |
| 5 | 0.66 | 0.54 | 0.56 | 0.58 | 1.00 | 0.61 | 0.61 | 0.54 | 0.64 | 0.65 | 0.69 | 0.57 |
| 6 | 0.65 | 0.60 | 0.56 | 0.62 | 0.61 | 1.00 | 0.66 | 0.56 | 0.66 | 0.63 | 0.56 | 0.50 |
| 7 | 0.66 | 0.53 | 0.54 | 0.62 | 0.61 | 0.66 | 1.00 | 0.55 | 0.68 | 0.65 | 0.57 | 0.51 |
| 8 | 0.57 | 0.63 | 0.63 | 0.60 | 0.54 | 0.56 | 0.55 | 1.00 | 0.59 | 0.53 | 0.55 | 0.49 |
| 9 | 0.71 | 0.60 | 0.57 | 0.67 | 0.64 | 0.66 | 0.68 | 0.59 | 1.00 | 0.69 | 0.61 | 0.54 |
| 10 | 0.66 | 0.54 | 0.55 | 0.58 | 0.65 | 0.63 | 0.65 | 0.53 | 0.69 | 1.00 | 0.59 | 0.55 |
| 11 | 0.62 | 0.52 | 0.52 | 0.51 | 0.69 | 0.56 | 0.57 | 0.55 | 0.61 | 0.59 | 1.00 | 0.59 |
| 12 | 0.57 | 0.45 | 0.47 | 0.48 | 0.57 | 0.50 | 0.51 | 0.49 | 0.54 | 0.55 | 0.59 | 1.00 |
The table contains GDT_TS values (calculated on the Cα atoms) between the predicted models.
Read more about the global distance test (GDT, also written as GDT_TS to represent "total score") measure.
© Laboratory of Theory of Biopolymers, Faculty of Chemistry, University of Warsaw 2013