Status: Done started: 2018-Dec-19 13:09:04 UTC
| Project Name | |
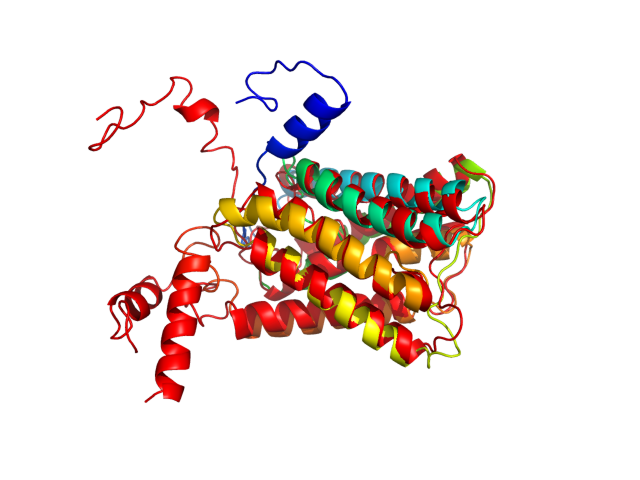
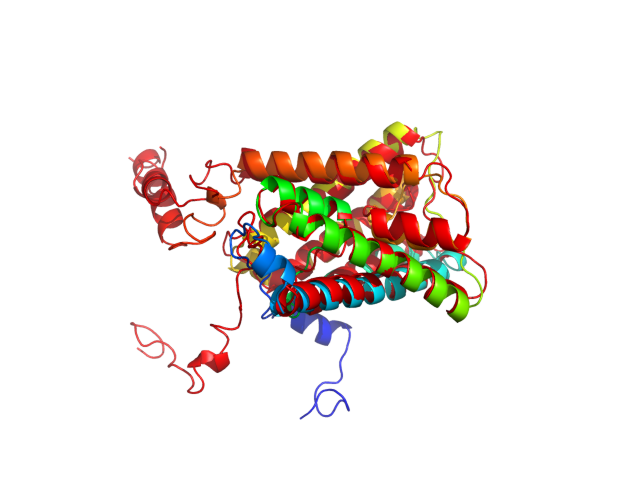
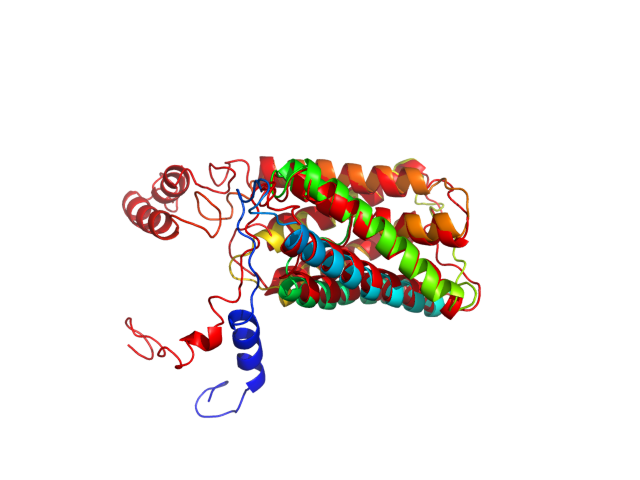
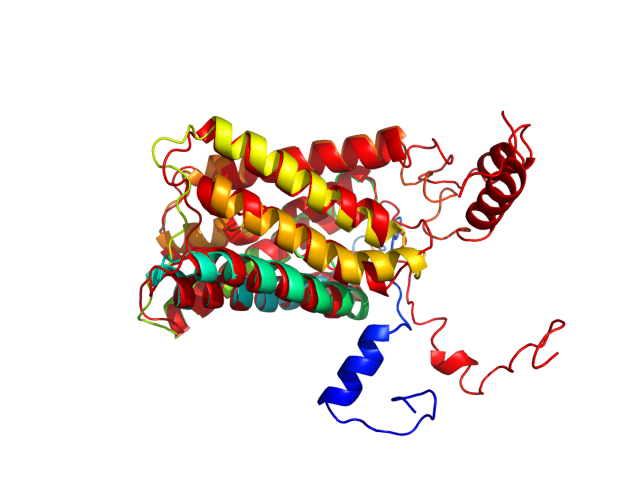
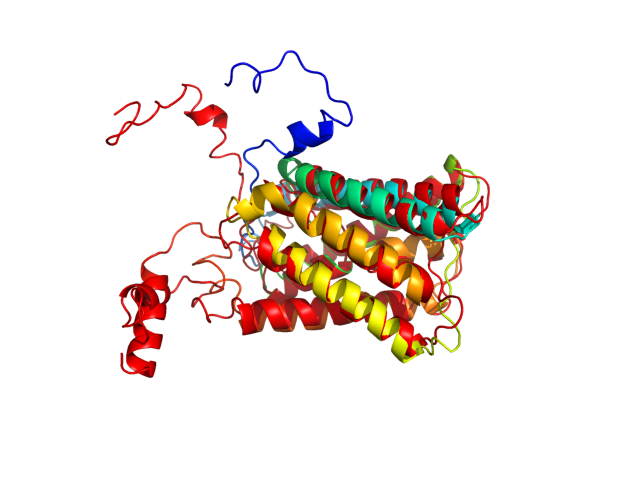
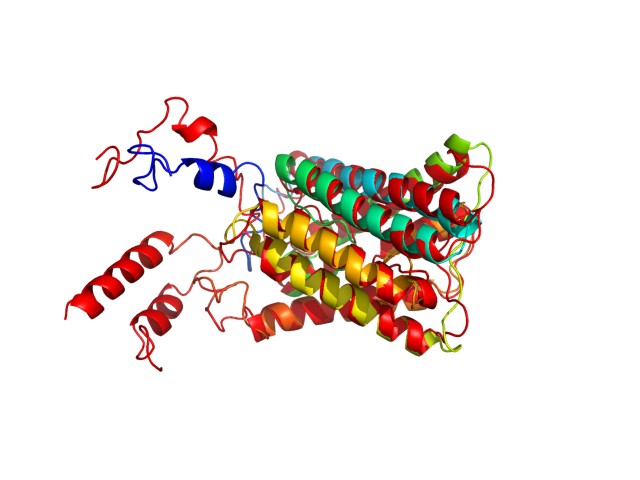
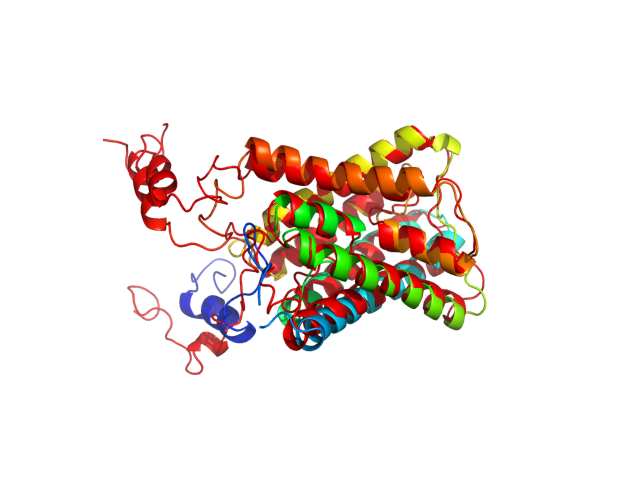
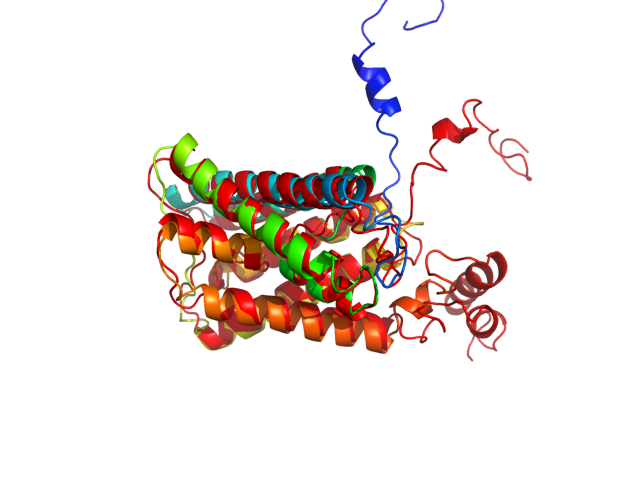
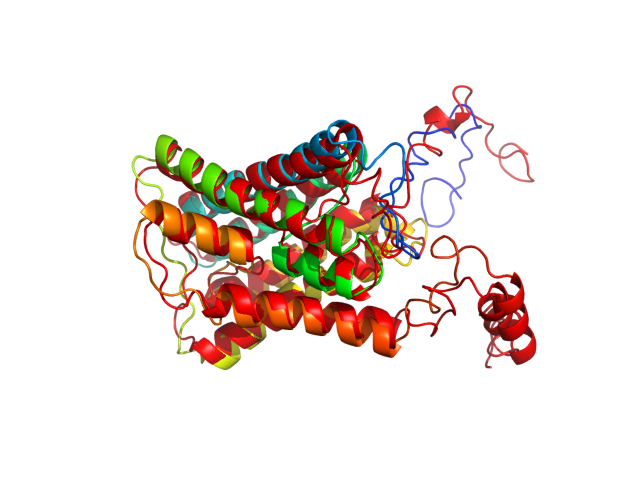
| Sequence | MESERGNSTE NKKPNELVSV ENPKSNLSFR YILIFFQEHY PPGFLKKVIA EVIATYLLVF VTCGAAAISA SDEHKVSRLG ASVAGGLIVT VMIYAVGHIS GAHMNPAVTF AFAAVRHFPW RQVPPYAAAQ LTGATSAAFT LRVLLHPIKH VGTTTPSGSD IQALIMEIVV TFSMMFITSA VATDTKAIGE LAGMAVGSAV CITSILAGPV SGGSMNPART IGPAMASNDY RGIWVYIIGP VCGTLLGAWS YNFIRVTDKP VHAIAPGQSF SFKLRRMKSN DEEQGV |
| Secondary structure | CCCCCCCCCC CCCCCCCCCC CCCCCCCCCC CCCCCCCCCC HHHHHHHHHH HHHHHHHHHH HHHHHHHHHC CCCCCHHHHH HHHHHHHHHH HHHHHHCCCC CCCCCHHHHH HHHHHCCCCC CCHHHHHHHH HHHHHHHHHH HHHHCCCCCC CCCCCCCCCH HHHHHHHHHH HHHHHHHHHH HHCCCCCCCC HHHHHHHHHH HHHHHHHHHH HCCCCCHHHH HHHHHHCCCC CCCCHHHHHH HHHHHHHHHH HHHHHCCCCC CCCCCCCCCH HHHHHHHCCC CCCCCC |
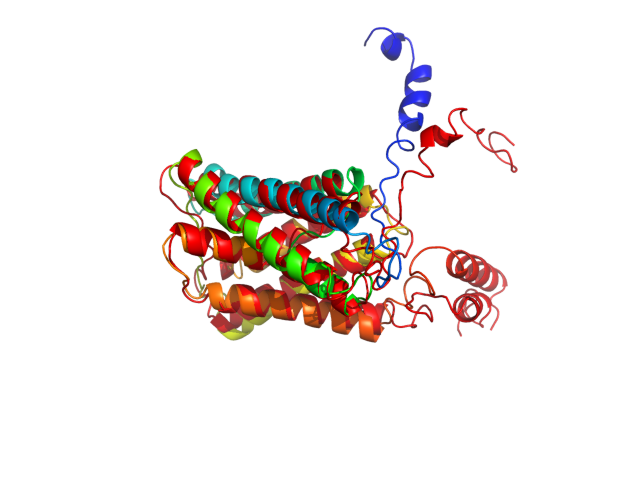
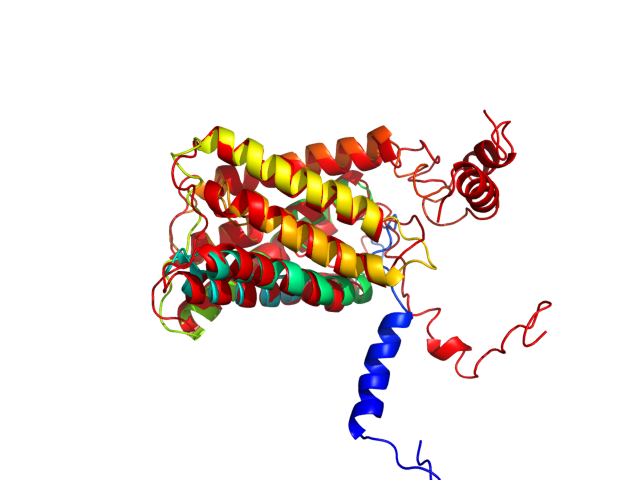
| Movie from predicted structures | To download the movie, right click on the desired file format:  
|
| Estimated finish time | 2018-Dec-19 17:05 UTC |
| Project Name |
| Project Name |
| Cluster # | 1 | 2 | 3 | 4 | 5 | 6 | 7 | 8 | 9 | 10 | 11 | 12 |
| Cluster density | 179.9 | 176.2 | 164.5 | 105.3 | 97.0 | 96.6 | 75.4 | 75.2 | 73.4 | 70.4 | 52.7 | 35.6 |
| Cluster size | 299 | 333 | 323 | 191 | 150 | 123 | 100 | 106 | 120 | 111 | 89 | 55 |
| Average cluster RMSD | 1.7 | 1.9 | 2.0 | 1.8 | 1.5 | 1.3 | 1.3 | 1.4 | 1.6 | 1.6 | 1.7 | 1.5 |
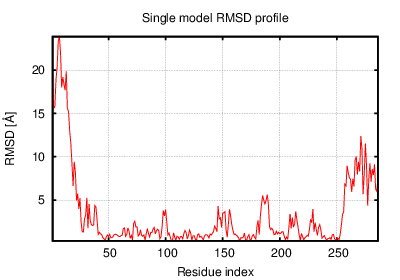
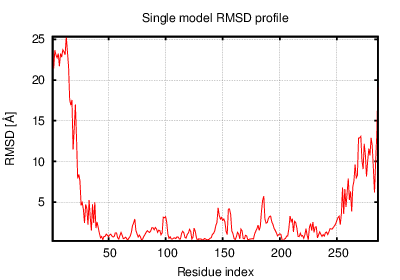
| # | 1 | 2 | 3 | 4 | 5 | 6 | 7 | 8 | 9 | 10 | 11 | 12 |
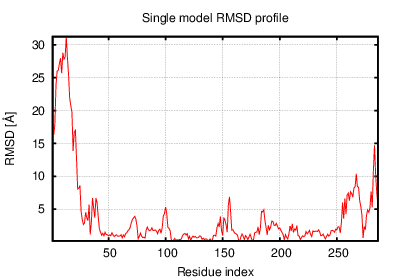
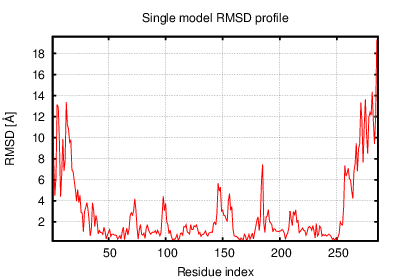
| RMSD | 5.56 | 7.08 | 7.58 | 4.43 | 5.57 | 6.46 | 4.20 | 3.94 | 5.76 | 5.27 | 5.66 | 3.69 |
| GDT_TS | 0.66 | 0.63 | 0.68 | 0.70 | 0.67 | 0.65 | 0.69 | 0.70 | 0.67 | 0.67 | 0.67 | 0.67 |
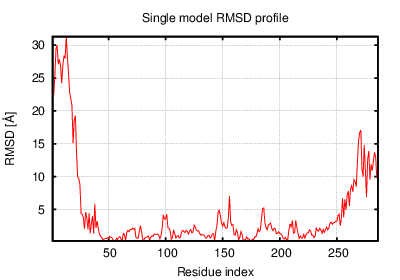
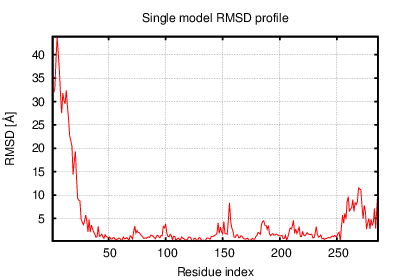
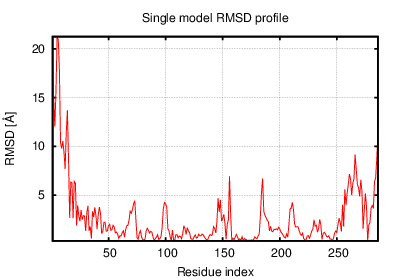
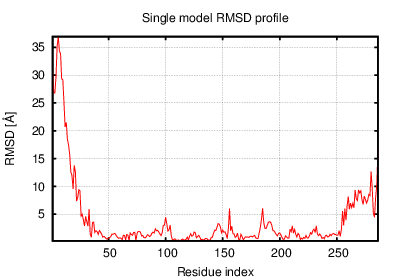
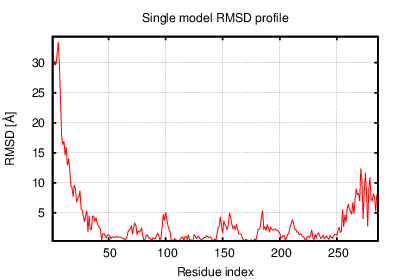
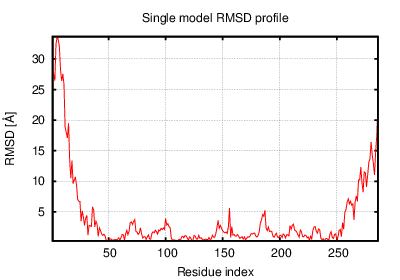
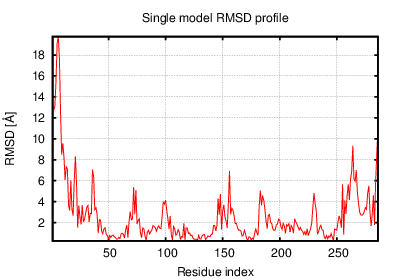
The table contains RMSD and GDT_TS values (calculated on the Cα atoms) between the predicted models and the input structure. Note that GDT_TS metric is intended as a more accurate measurement than the more common RMSD.
Read more about the root-mean-square deviation (RMSD) measure
Read more about the global distance test (GDT, also written as GDT_TS to represent "total score") measure.
| # | 1 | 2 | 3 | 4 | 5 | 6 | 7 | 8 | 9 | 10 | 11 | 12 |
| 1 | 0.00 | 5.08 | 4.69 | 4.62 | 3.88 | 4.61 | 6.23 | 5.95 | 2.54 | 3.17 | 2.93 | 6.17 |
| 2 | 5.08 | 0.00 | 3.50 | 6.07 | 3.50 | 3.35 | 7.71 | 6.97 | 5.18 | 5.61 | 5.02 | 7.01 |
| 3 | 4.69 | 3.50 | 0.00 | 5.52 | 3.96 | 3.22 | 7.51 | 6.74 | 4.82 | 4.93 | 4.87 | 7.10 |
| 4 | 4.62 | 6.07 | 5.52 | 0.00 | 4.72 | 4.86 | 4.26 | 3.59 | 4.90 | 3.60 | 4.99 | 4.13 |
| 5 | 3.88 | 3.50 | 3.96 | 4.72 | 0.00 | 3.83 | 5.96 | 5.71 | 3.60 | 4.59 | 3.31 | 5.80 |
| 6 | 4.61 | 3.35 | 3.22 | 4.86 | 3.83 | 0.00 | 7.07 | 6.14 | 4.56 | 5.16 | 4.89 | 6.32 |
| 7 | 6.23 | 7.71 | 7.51 | 4.26 | 5.96 | 7.07 | 0.00 | 3.23 | 6.72 | 5.48 | 6.41 | 4.27 |
| 8 | 5.95 | 6.97 | 6.74 | 3.59 | 5.71 | 6.14 | 3.23 | 0.00 | 6.32 | 4.86 | 6.14 | 2.70 |
| 9 | 2.54 | 5.18 | 4.82 | 4.90 | 3.60 | 4.56 | 6.72 | 6.32 | 0.00 | 3.98 | 2.62 | 6.32 |
| 10 | 3.17 | 5.61 | 4.93 | 3.60 | 4.59 | 5.16 | 5.48 | 4.86 | 3.98 | 0.00 | 4.21 | 5.18 |
| 11 | 2.93 | 5.02 | 4.87 | 4.99 | 3.31 | 4.89 | 6.41 | 6.14 | 2.62 | 4.21 | 0.00 | 6.05 |
| 12 | 6.17 | 7.01 | 7.10 | 4.13 | 5.80 | 6.32 | 4.27 | 2.70 | 6.32 | 5.18 | 6.05 | 0.00 |
The table contains RMSD values (calculated on the Cα atoms) between the predicted models.
Read more about the root-mean-square deviation (RMSD) measure.
| # | 1 | 2 | 3 | 4 | 5 | 6 | 7 | 8 | 9 | 10 | 11 | 12 |
| 1 | 1.00 | 0.69 | 0.70 | 0.69 | 0.74 | 0.71 | 0.71 | 0.71 | 0.76 | 0.76 | 0.74 | 0.67 |
| 2 | 0.69 | 1.00 | 0.74 | 0.67 | 0.75 | 0.76 | 0.65 | 0.64 | 0.72 | 0.69 | 0.65 | 0.63 |
| 3 | 0.70 | 0.74 | 1.00 | 0.71 | 0.73 | 0.74 | 0.67 | 0.68 | 0.72 | 0.70 | 0.66 | 0.65 |
| 4 | 0.69 | 0.67 | 0.71 | 1.00 | 0.71 | 0.69 | 0.73 | 0.71 | 0.71 | 0.72 | 0.69 | 0.69 |
| 5 | 0.74 | 0.75 | 0.73 | 0.71 | 1.00 | 0.76 | 0.69 | 0.68 | 0.75 | 0.69 | 0.70 | 0.65 |
| 6 | 0.71 | 0.76 | 0.74 | 0.69 | 0.76 | 1.00 | 0.68 | 0.68 | 0.71 | 0.71 | 0.67 | 0.65 |
| 7 | 0.71 | 0.65 | 0.67 | 0.73 | 0.69 | 0.68 | 1.00 | 0.74 | 0.70 | 0.69 | 0.69 | 0.69 |
| 8 | 0.71 | 0.64 | 0.68 | 0.71 | 0.68 | 0.68 | 0.74 | 1.00 | 0.69 | 0.70 | 0.69 | 0.75 |
| 9 | 0.76 | 0.72 | 0.72 | 0.71 | 0.75 | 0.71 | 0.70 | 0.69 | 1.00 | 0.71 | 0.76 | 0.68 |
| 10 | 0.76 | 0.69 | 0.70 | 0.72 | 0.69 | 0.71 | 0.69 | 0.70 | 0.71 | 1.00 | 0.69 | 0.68 |
| 11 | 0.74 | 0.65 | 0.66 | 0.69 | 0.70 | 0.67 | 0.69 | 0.69 | 0.76 | 0.69 | 1.00 | 0.68 |
| 12 | 0.67 | 0.63 | 0.65 | 0.69 | 0.65 | 0.65 | 0.69 | 0.75 | 0.68 | 0.68 | 0.68 | 1.00 |
The table contains GDT_TS values (calculated on the Cα atoms) between the predicted models.
Read more about the global distance test (GDT, also written as GDT_TS to represent "total score") measure.
© Laboratory of Theory of Biopolymers, Faculty of Chemistry, University of Warsaw 2013