Status: Done started: 2018-Dec-27 03:29:56 UTC
| Project Name | |
| Sequence | TKPHVNVGTI GHVDHGKTTL TAAITTVLAK TYGGAARAFD QIDNAPEEKA RGITINTSHV EYDTPTRHYA HVDCPGHADY VKNMITGAAQ MDGAILVVAA TDGPMPQTRE HILLGRQVGV PYIIVFLNKC DMVDDEELLE LVEMEVRELL SQYDFPGDDT PIVRGSALKA LEGDAEWEAK ILELAGFLDS YIPEPERAID KPFLLPIEDV FSISGRGTVV TGRVERGIIK VGEEVEIVGI KETQKSTCTG VEMFRKLLDE GRAGENVGVL LRGIKREEIE RGQVLAKPGT IKPHTKFESE VYILSKDEGG RHTPFFKGYR PQFYFRTTDV TGTIELPEGV EMVMPGDNIK MVVTLIHPIA MDDGLRFAIR EGGRTVGAGV VAKVLG |
| Secondary structure | CCCEEEEEEE CCCCCCHHHH HHHHHHHHHH HHCCCCCCCC CCCCCCCCCC CCCCCCCEEE EEECCCCEEE EEECCCHHHH HHHHHHCCCC CCEEEEEEEC CCCCCHHHHH HHHHHHHHCC CCEEEEEECC CCCCCHHHHH HHHHHHHHHH HHCCCCCCCC CEEECCHHHH HCCCHHHHHH HHHHHHHHHH HCCCCCCCCC CCCEEECCEE EEECCCEEEE EEECCCCEEE CCCEEEEECC CCCEEEEEEE EEECCEEECE EECCCEEEEE ECCCCCCCCC CCCEEECCCC CCEEEEEEEE EEECCCCCCC CCCCEECCCC CEEEECCEEE EEEEECCCCC CEECCCCEEE EEEEEEEEEE CCCCCEEEEE ECCEEEEEEE EEEECC |
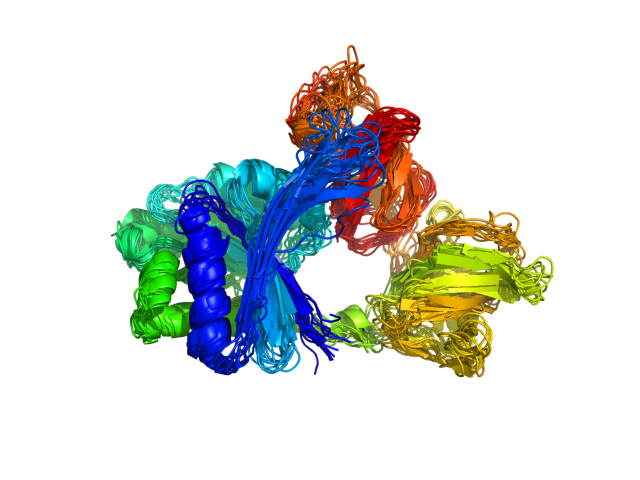
| Movie from predicted structures | To download the movie, right click on the desired file format:  
|
| Estimated finish time | 2018-Dec-27 07:39 UTC |
| Project Name |
| Project Name |
| Cluster # | 1 | 2 | 3 | 4 | 5 | 6 | 7 | 8 | 9 | 10 | 11 | 12 |
| Cluster density | 224.5 | 221.1 | 202.9 | 142.6 | 117.6 | 106.2 | 98.4 | 90.2 | 89.5 | 77.0 | 75.1 | 58.1 |
| Cluster size | 301 | 295 | 283 | 193 | 158 | 146 | 127 | 113 | 112 | 108 | 88 | 76 |
| Average cluster RMSD | 1.3 | 1.3 | 1.4 | 1.4 | 1.3 | 1.4 | 1.3 | 1.3 | 1.3 | 1.4 | 1.2 | 1.3 |
| # | 1 | 2 | 3 | 4 | 5 | 6 | 7 | 8 | 9 | 10 | 11 | 12 |
| RMSD | 3.67 | 3.83 | 3.84 | 3.55 | 3.76 | 3.31 | 3.88 | 3.80 | 3.56 | 3.58 | 3.47 | 3.43 |
| GDT_TS | 0.57 | 0.58 | 0.57 | 0.61 | 0.59 | 0.62 | 0.56 | 0.59 | 0.61 | 0.60 | 0.60 | 0.61 |
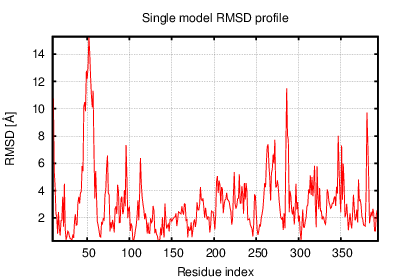
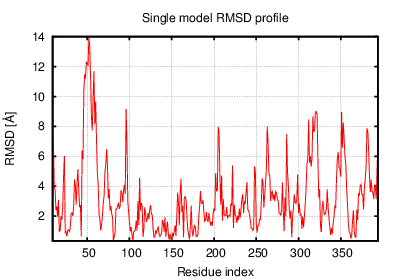
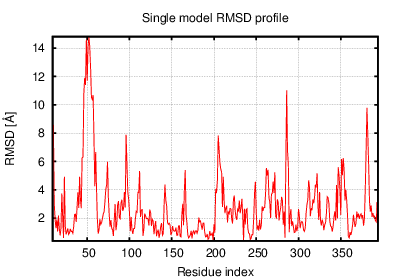
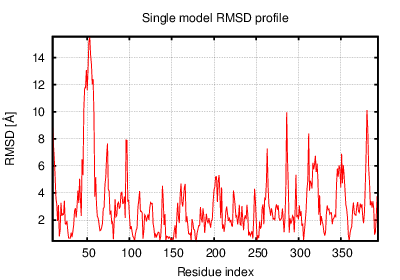
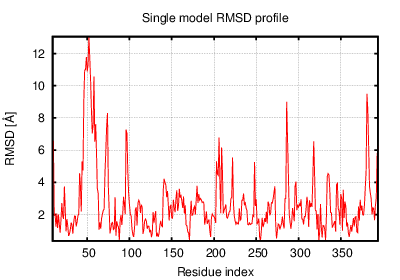
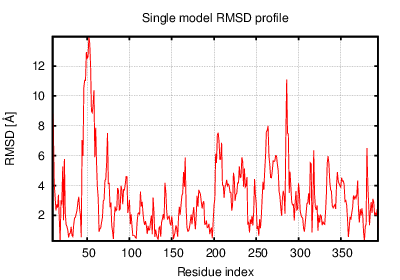
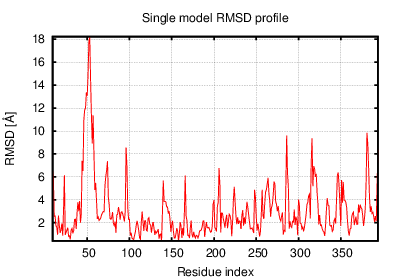
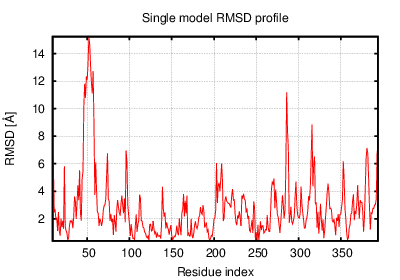
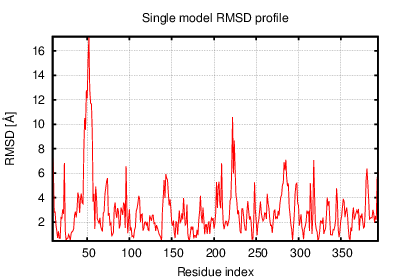
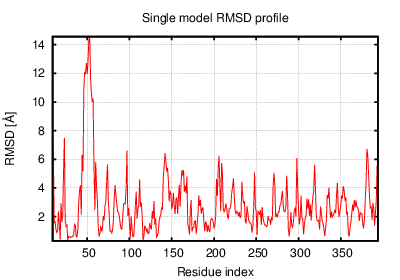
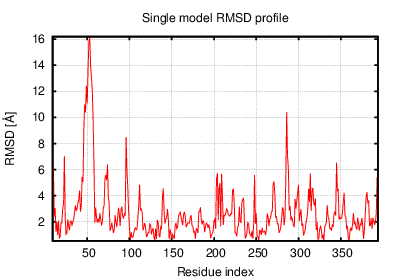
The table contains RMSD and GDT_TS values (calculated on the Cα atoms) between the predicted models and the input structure. Note that GDT_TS metric is intended as a more accurate measurement than the more common RMSD.
Read more about the root-mean-square deviation (RMSD) measure
Read more about the global distance test (GDT, also written as GDT_TS to represent "total score") measure.
| # | 1 | 2 | 3 | 4 | 5 | 6 | 7 | 8 | 9 | 10 | 11 | 12 |
| 1 | 0.00 | 2.67 | 2.27 | 2.18 | 2.02 | 2.59 | 2.53 | 2.19 | 2.50 | 3.15 | 2.86 | 2.67 |
| 2 | 2.67 | 0.00 | 2.84 | 2.17 | 2.33 | 2.97 | 2.07 | 2.46 | 2.51 | 3.23 | 2.84 | 2.41 |
| 3 | 2.27 | 2.84 | 0.00 | 2.42 | 2.35 | 3.09 | 2.51 | 2.63 | 2.94 | 3.58 | 3.24 | 3.22 |
| 4 | 2.18 | 2.17 | 2.42 | 0.00 | 2.11 | 2.79 | 2.19 | 2.15 | 2.44 | 3.11 | 2.74 | 2.49 |
| 5 | 2.02 | 2.33 | 2.35 | 2.11 | 0.00 | 2.89 | 2.34 | 2.31 | 2.39 | 3.10 | 2.83 | 2.50 |
| 6 | 2.59 | 2.97 | 3.09 | 2.79 | 2.89 | 0.00 | 2.83 | 3.02 | 2.32 | 2.73 | 2.36 | 2.52 |
| 7 | 2.53 | 2.07 | 2.51 | 2.19 | 2.34 | 2.83 | 0.00 | 2.64 | 2.52 | 3.29 | 2.97 | 2.66 |
| 8 | 2.19 | 2.46 | 2.63 | 2.15 | 2.31 | 3.02 | 2.64 | 0.00 | 2.57 | 3.40 | 3.22 | 2.72 |
| 9 | 2.50 | 2.51 | 2.94 | 2.44 | 2.39 | 2.32 | 2.52 | 2.57 | 0.00 | 2.61 | 2.41 | 1.99 |
| 10 | 3.15 | 3.23 | 3.58 | 3.11 | 3.10 | 2.73 | 3.29 | 3.40 | 2.61 | 0.00 | 2.25 | 2.48 |
| 11 | 2.86 | 2.84 | 3.24 | 2.74 | 2.83 | 2.36 | 2.97 | 3.22 | 2.41 | 2.25 | 0.00 | 2.37 |
| 12 | 2.67 | 2.41 | 3.22 | 2.49 | 2.50 | 2.52 | 2.66 | 2.72 | 1.99 | 2.48 | 2.37 | 0.00 |
The table contains RMSD values (calculated on the Cα atoms) between the predicted models.
Read more about the root-mean-square deviation (RMSD) measure.
| # | 1 | 2 | 3 | 4 | 5 | 6 | 7 | 8 | 9 | 10 | 11 | 12 |
| 1 | 1.00 | 0.65 | 0.70 | 0.73 | 0.72 | 0.65 | 0.66 | 0.74 | 0.69 | 0.62 | 0.61 | 0.65 |
| 2 | 0.65 | 1.00 | 0.64 | 0.72 | 0.71 | 0.63 | 0.75 | 0.67 | 0.67 | 0.65 | 0.65 | 0.69 |
| 3 | 0.70 | 0.64 | 1.00 | 0.69 | 0.74 | 0.64 | 0.67 | 0.69 | 0.66 | 0.60 | 0.61 | 0.64 |
| 4 | 0.73 | 0.72 | 0.69 | 1.00 | 0.73 | 0.66 | 0.73 | 0.76 | 0.70 | 0.65 | 0.68 | 0.70 |
| 5 | 0.72 | 0.71 | 0.74 | 0.73 | 1.00 | 0.65 | 0.71 | 0.70 | 0.69 | 0.63 | 0.65 | 0.67 |
| 6 | 0.65 | 0.63 | 0.64 | 0.66 | 0.65 | 1.00 | 0.64 | 0.65 | 0.71 | 0.69 | 0.73 | 0.71 |
| 7 | 0.66 | 0.75 | 0.67 | 0.73 | 0.71 | 0.64 | 1.00 | 0.68 | 0.68 | 0.63 | 0.65 | 0.68 |
| 8 | 0.74 | 0.67 | 0.69 | 0.76 | 0.70 | 0.65 | 0.68 | 1.00 | 0.67 | 0.62 | 0.62 | 0.68 |
| 9 | 0.69 | 0.67 | 0.66 | 0.70 | 0.69 | 0.71 | 0.68 | 0.67 | 1.00 | 0.68 | 0.69 | 0.77 |
| 10 | 0.62 | 0.65 | 0.60 | 0.65 | 0.63 | 0.69 | 0.63 | 0.62 | 0.68 | 1.00 | 0.73 | 0.69 |
| 11 | 0.61 | 0.65 | 0.61 | 0.68 | 0.65 | 0.73 | 0.65 | 0.62 | 0.69 | 0.73 | 1.00 | 0.69 |
| 12 | 0.65 | 0.69 | 0.64 | 0.70 | 0.67 | 0.71 | 0.68 | 0.68 | 0.77 | 0.69 | 0.69 | 1.00 |
The table contains GDT_TS values (calculated on the Cα atoms) between the predicted models.
Read more about the global distance test (GDT, also written as GDT_TS to represent "total score") measure.
© Laboratory of Theory of Biopolymers, Faculty of Chemistry, University of Warsaw 2013