Status: Done started: 2018-Dec-27 03:46:54 UTC
| Project Name | |
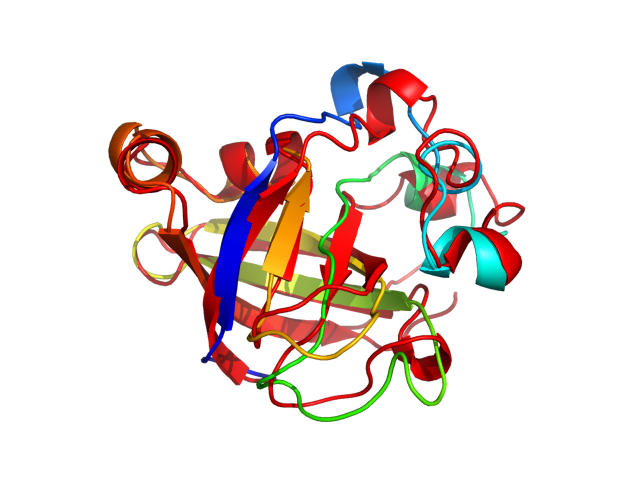
| Sequence | SASNVRATYH FYNAQQNGWD LRKVSAYCAT WDADKPYSWR SKYGWTAFCG PVGPHGRAAC GKCLRVTNTK TRAETTVRIV DQCSNGGLDL DWSVFKKLDT DGSGYLRGHL IVNYQFVNCG N |
| Secondary structure | CEEEEEEEEE CCCCCCCCCC CCCCCCCCHH HHCCCCHHHH CCCEEEEECC CCCCCCCCCC CCEEEEEECC CCCEEEEEEE EECCCCCEEE EHHHHHHHCC CCHHHHHCCE EEEEEEECCC C |
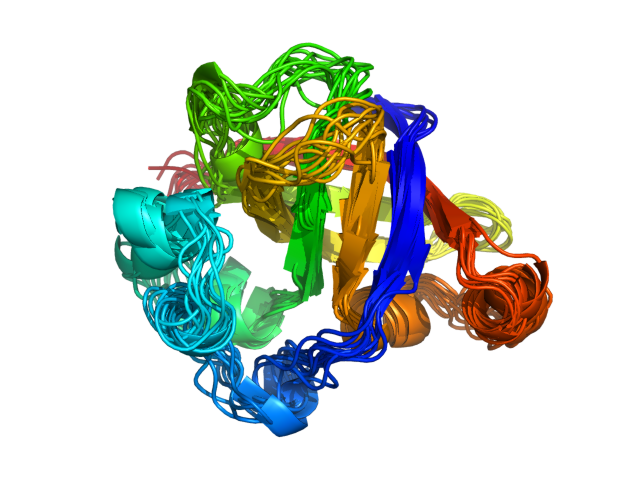
| Movie from predicted structures | To download the movie, right click on the desired file format:  
|
| Estimated finish time | 2018-Dec-27 07:21 UTC |
| Project Name |


| Project Name |
| Cluster # | 1 | 2 | 3 | 4 | 5 | 6 | 7 | 8 | 9 | 10 | 11 | 12 |
| Cluster density | 167.1 | 160.0 | 130.8 | 129.7 | 129.7 | 121.5 | 117.1 | 115.3 | 104.9 | 95.3 | 91.8 | 83.9 |
| Cluster size | 241 | 228 | 176 | 185 | 156 | 180 | 157 | 161 | 143 | 137 | 128 | 108 |
| Average cluster RMSD | 1.4 | 1.4 | 1.3 | 1.4 | 1.2 | 1.5 | 1.3 | 1.4 | 1.4 | 1.4 | 1.4 | 1.3 |
| # | 1 | 2 | 3 | 4 | 5 | 6 | 7 | 8 | 9 | 10 | 11 | 12 |
| RMSD | 2.73 | 2.45 | 2.47 | 2.50 | 2.57 | 2.29 | 2.47 | 2.35 | 2.39 | 2.36 | 2.54 | 2.45 |
| GDT_TS | 0.70 | 0.73 | 0.72 | 0.70 | 0.70 | 0.73 | 0.73 | 0.70 | 0.72 | 0.71 | 0.71 | 0.70 |
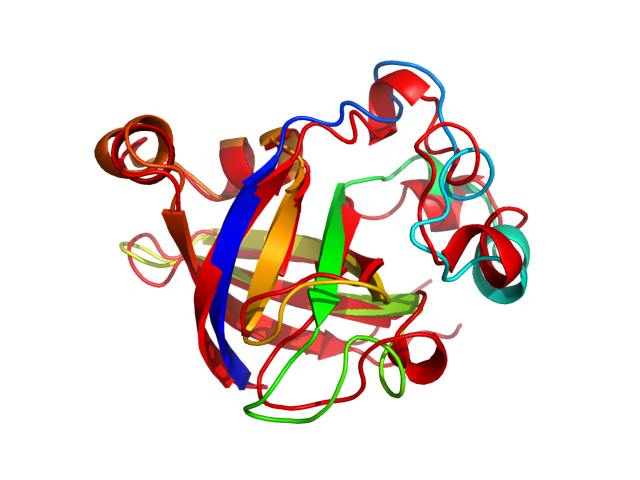
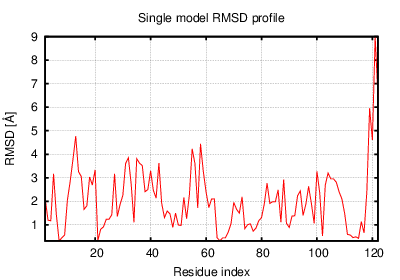
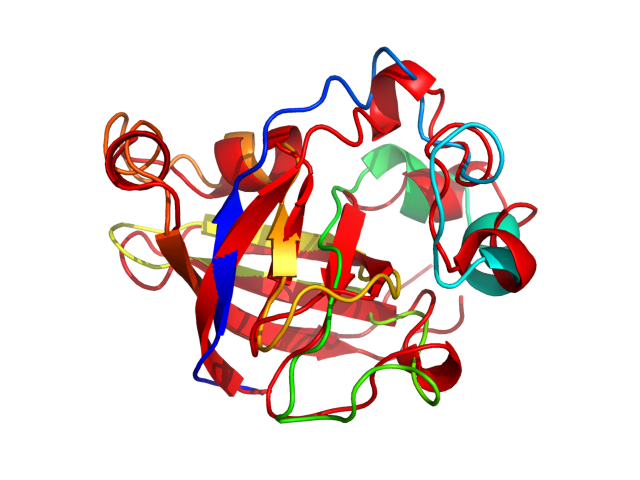
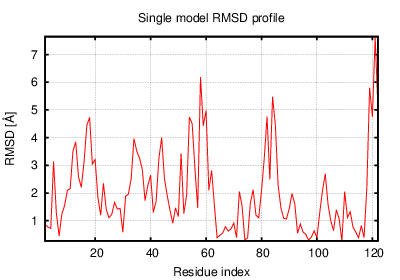
The table contains RMSD and GDT_TS values (calculated on the Cα atoms) between the predicted models and the input structure. Note that GDT_TS metric is intended as a more accurate measurement than the more common RMSD.
Read more about the root-mean-square deviation (RMSD) measure
Read more about the global distance test (GDT, also written as GDT_TS to represent "total score") measure.
| # | 1 | 2 | 3 | 4 | 5 | 6 | 7 | 8 | 9 | 10 | 11 | 12 |
| 1 | 0.00 | 1.92 | 2.16 | 2.10 | 1.87 | 2.05 | 2.11 | 1.94 | 1.95 | 2.23 | 2.29 | 2.26 |
| 2 | 1.92 | 0.00 | 1.58 | 1.93 | 1.68 | 1.93 | 2.03 | 1.83 | 1.76 | 2.17 | 1.98 | 2.01 |
| 3 | 2.16 | 1.58 | 0.00 | 1.98 | 1.84 | 2.05 | 1.97 | 1.87 | 1.74 | 2.23 | 2.08 | 2.05 |
| 4 | 2.10 | 1.93 | 1.98 | 0.00 | 1.94 | 2.17 | 1.66 | 2.20 | 1.87 | 2.01 | 2.17 | 1.96 |
| 5 | 1.87 | 1.68 | 1.84 | 1.94 | 0.00 | 1.94 | 2.03 | 2.14 | 1.93 | 2.33 | 2.01 | 1.94 |
| 6 | 2.05 | 1.93 | 2.05 | 2.17 | 1.94 | 0.00 | 2.13 | 1.88 | 1.99 | 2.20 | 2.21 | 2.02 |
| 7 | 2.11 | 2.03 | 1.97 | 1.66 | 2.03 | 2.13 | 0.00 | 2.18 | 1.85 | 1.84 | 2.15 | 1.68 |
| 8 | 1.94 | 1.83 | 1.87 | 2.20 | 2.14 | 1.88 | 2.18 | 0.00 | 2.03 | 2.25 | 2.08 | 2.04 |
| 9 | 1.95 | 1.76 | 1.74 | 1.87 | 1.93 | 1.99 | 1.85 | 2.03 | 0.00 | 1.83 | 2.09 | 2.01 |
| 10 | 2.23 | 2.17 | 2.23 | 2.01 | 2.33 | 2.20 | 1.84 | 2.25 | 1.83 | 0.00 | 2.31 | 1.91 |
| 11 | 2.29 | 1.98 | 2.08 | 2.17 | 2.01 | 2.21 | 2.15 | 2.08 | 2.09 | 2.31 | 0.00 | 1.98 |
| 12 | 2.26 | 2.01 | 2.05 | 1.96 | 1.94 | 2.02 | 1.68 | 2.04 | 2.01 | 1.91 | 1.98 | 0.00 |
The table contains RMSD values (calculated on the Cα atoms) between the predicted models.
Read more about the root-mean-square deviation (RMSD) measure.
| # | 1 | 2 | 3 | 4 | 5 | 6 | 7 | 8 | 9 | 10 | 11 | 12 |
| 1 | 1.00 | 0.77 | 0.75 | 0.74 | 0.76 | 0.75 | 0.77 | 0.77 | 0.78 | 0.75 | 0.73 | 0.75 |
| 2 | 0.77 | 1.00 | 0.83 | 0.77 | 0.79 | 0.81 | 0.79 | 0.80 | 0.81 | 0.76 | 0.79 | 0.77 |
| 3 | 0.75 | 0.83 | 1.00 | 0.77 | 0.76 | 0.78 | 0.80 | 0.78 | 0.81 | 0.74 | 0.76 | 0.75 |
| 4 | 0.74 | 0.77 | 0.77 | 1.00 | 0.77 | 0.75 | 0.81 | 0.74 | 0.79 | 0.78 | 0.74 | 0.77 |
| 5 | 0.76 | 0.79 | 0.76 | 0.77 | 1.00 | 0.76 | 0.77 | 0.73 | 0.76 | 0.73 | 0.77 | 0.78 |
| 6 | 0.75 | 0.81 | 0.78 | 0.75 | 0.76 | 1.00 | 0.77 | 0.77 | 0.78 | 0.76 | 0.76 | 0.78 |
| 7 | 0.77 | 0.79 | 0.80 | 0.81 | 0.77 | 0.77 | 1.00 | 0.74 | 0.80 | 0.80 | 0.77 | 0.81 |
| 8 | 0.77 | 0.80 | 0.78 | 0.74 | 0.73 | 0.77 | 0.74 | 1.00 | 0.77 | 0.74 | 0.77 | 0.77 |
| 9 | 0.78 | 0.81 | 0.81 | 0.79 | 0.76 | 0.78 | 0.80 | 0.77 | 1.00 | 0.81 | 0.77 | 0.79 |
| 10 | 0.75 | 0.76 | 0.74 | 0.78 | 0.73 | 0.76 | 0.80 | 0.74 | 0.81 | 1.00 | 0.76 | 0.79 |
| 11 | 0.73 | 0.79 | 0.76 | 0.74 | 0.77 | 0.76 | 0.77 | 0.77 | 0.77 | 0.76 | 1.00 | 0.79 |
| 12 | 0.75 | 0.77 | 0.75 | 0.77 | 0.78 | 0.78 | 0.81 | 0.77 | 0.79 | 0.79 | 0.79 | 1.00 |
The table contains GDT_TS values (calculated on the Cα atoms) between the predicted models.
Read more about the global distance test (GDT, also written as GDT_TS to represent "total score") measure.
© Laboratory of Theory of Biopolymers, Faculty of Chemistry, University of Warsaw 2013