Status: Done started: 2018-Jan-11 09:33:03 UTC
| Project Name | C10F |
| Sequence | HHHHHHTPQN ITDLCAEYHN TQIHTLNDKI FSYTESLAGK REMAIITFKN GATFQVEVPG SQHIDSQKKA IERMKDTLRI AYLTEAKVEK LCVWNNKTPH AIAAISMANS SGGSGGGSGP ALPEDGGSGA FPPGHFKDPK RLYCKNGGFF LRIHPDGRVD GVREKSDPHI KLQLQAEERG VVSIKGVCAN RYLAMKEDGR LLASKCVTDE CFFFERLESN NYNTYRSRKY TSWYVALKRT GQYKLGSKTG PGQKAILFLP MSAKS |
| Secondary structure | CCCCCCCCCC HHHHHHHCCC EEEEECCCCC CEEEEEEECC EEEEEEEECC CEEEEECCCC CCCCHHHHHH HHHHHHHHHH HHHHCCCCCE EEEECCCCCC EEEECCCCCC CCCCCCCCCC CCCCCCCCCC CCCCCCCCCC CCEEECCEEE CCCCCCCCCC CCCCCCCCCC CEEEEECCCC CEEEEEECCE ECCCEECCCE ECCCCCCCCC CCCCCEECCC CCEECCCCCC CCCCCCCCCC CCCCCCCCCC CCCCCCCCCC CCCCC |
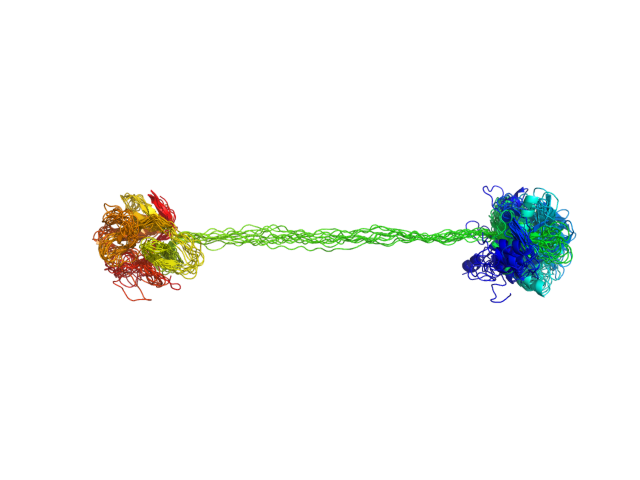
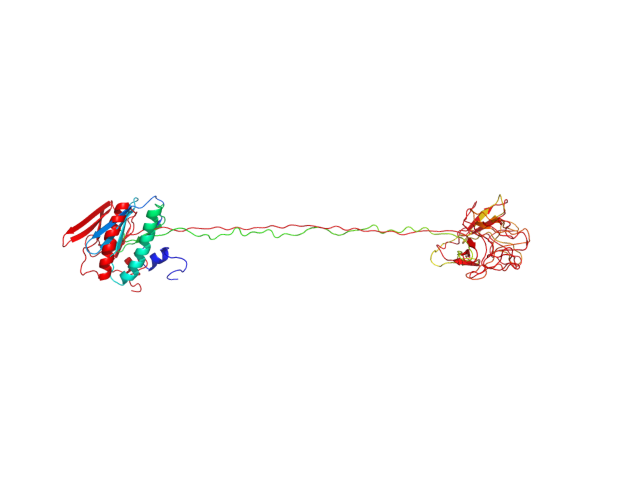
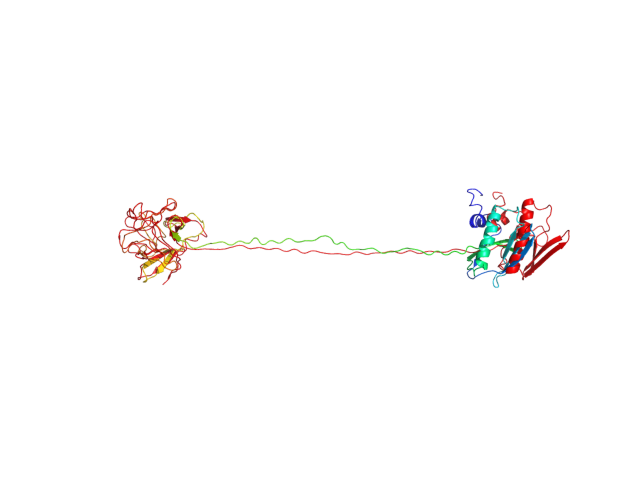
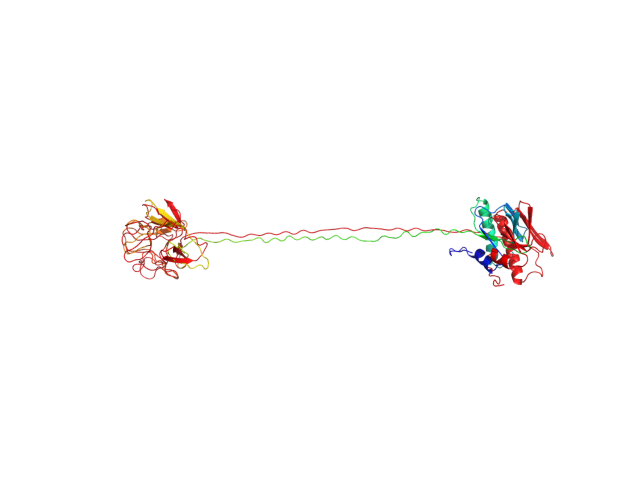
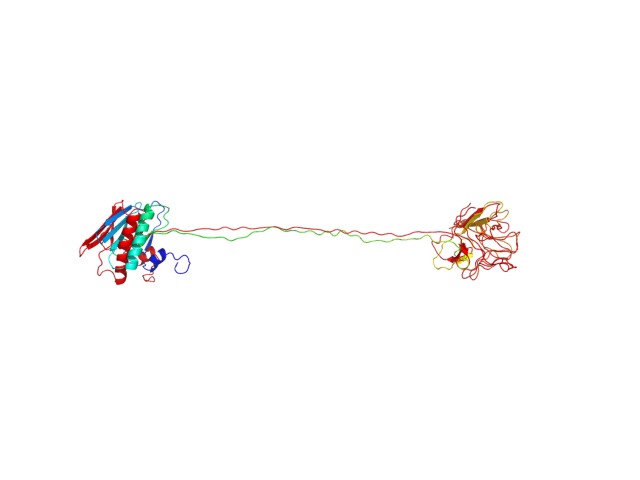
| Movie from predicted structures | To download the movie, right click on the desired file format:  
|
| Estimated finish time | 2018-Jan-11 13:27 UTC |
| Project Name | C10F |
| Project Name | C10F |
| Cluster # | 1 | 2 | 3 | 4 | 5 | 6 | 7 | 8 | 9 | 10 | 11 | 12 |
| Cluster density | 138.9 | 123.4 | 100.7 | 88.2 | 88.1 | 82.1 | 75.2 | 74.6 | 55.9 | 52.4 | 43.4 | 35.4 |
| Cluster size | 294 | 285 | 225 | 174 | 179 | 176 | 143 | 154 | 110 | 107 | 83 | 70 |
| Average cluster RMSD | 2.1 | 2.3 | 2.2 | 2.0 | 2.0 | 2.1 | 1.9 | 2.1 | 2.0 | 2.0 | 1.9 | 2.0 |
| # | 1 | 2 | 3 | 4 | 5 | 6 | 7 | 8 | 9 | 10 | 11 | 12 |
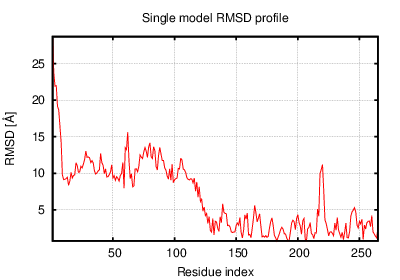
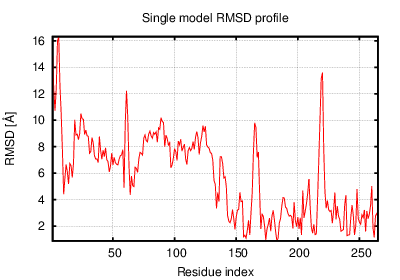
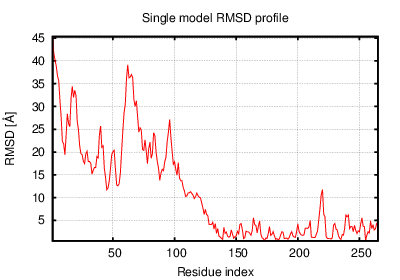
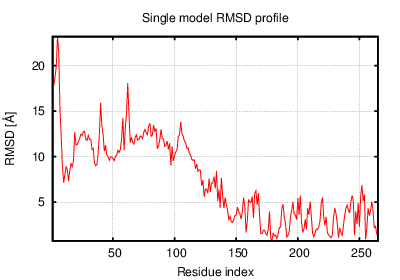
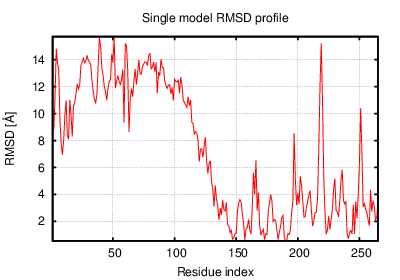
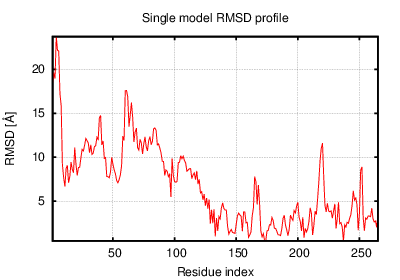
| RMSD | 6.88 | 7.05 | 6.67 | 5.84 | 11.90 | 7.00 | 9.02 | 7.02 | 14.00 | 7.14 | 6.80 | 5.74 |
| GDT_TS | 0.40 | 0.40 | 0.42 | 0.43 | 0.34 | 0.39 | 0.37 | 0.38 | 0.34 | 0.40 | 0.42 | 0.43 |
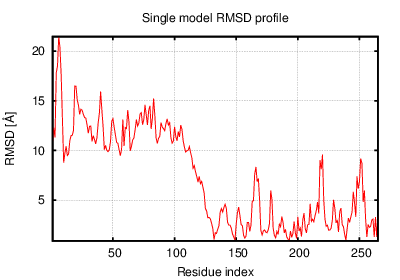
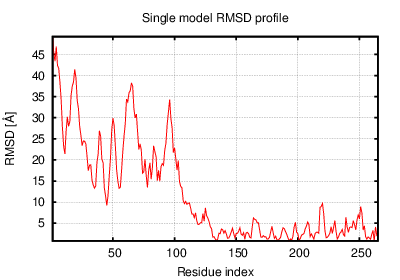
The table contains RMSD and GDT_TS values (calculated on the Cα atoms) between the predicted models and the input structure. Note that GDT_TS metric is intended as a more accurate measurement than the more common RMSD.
Read more about the root-mean-square deviation (RMSD) measure
Read more about the global distance test (GDT, also written as GDT_TS to represent "total score") measure.
| # | 1 | 2 | 3 | 4 | 5 | 6 | 7 | 8 | 9 | 10 | 11 | 12 |
| 1 | 0.00 | 3.82 | 5.58 | 4.18 | 10.40 | 3.61 | 6.58 | 3.52 | 12.10 | 3.70 | 4.83 | 5.18 |
| 2 | 3.82 | 0.00 | 5.12 | 4.72 | 9.31 | 4.18 | 6.47 | 4.97 | 12.90 | 5.19 | 3.96 | 4.85 |
| 3 | 5.58 | 5.12 | 0.00 | 4.36 | 6.86 | 4.30 | 6.05 | 6.97 | 13.40 | 6.06 | 3.02 | 2.99 |
| 4 | 4.18 | 4.72 | 4.36 | 0.00 | 9.72 | 3.94 | 6.91 | 4.78 | 12.90 | 4.39 | 3.89 | 3.78 |
| 5 | 10.40 | 9.31 | 6.86 | 9.72 | 0.00 | 8.98 | 8.44 | 11.90 | 8.77 | 10.80 | 7.78 | 8.13 |
| 6 | 3.61 | 4.18 | 4.30 | 3.94 | 8.98 | 0.00 | 6.09 | 4.94 | 13.40 | 4.37 | 3.83 | 4.09 |
| 7 | 6.58 | 6.47 | 6.05 | 6.91 | 8.44 | 6.09 | 0.00 | 8.09 | 14.40 | 7.38 | 6.20 | 6.23 |
| 8 | 3.52 | 4.97 | 6.97 | 4.78 | 11.90 | 4.94 | 8.09 | 0.00 | 10.60 | 4.27 | 6.09 | 6.34 |
| 9 | 12.10 | 12.90 | 13.40 | 12.90 | 8.77 | 13.40 | 14.40 | 10.60 | 0.00 | 12.60 | 13.90 | 14.10 |
| 10 | 3.70 | 5.19 | 6.06 | 4.39 | 10.80 | 4.37 | 7.38 | 4.27 | 12.60 | 0.00 | 5.64 | 5.74 |
| 11 | 4.83 | 3.96 | 3.02 | 3.89 | 7.78 | 3.83 | 6.20 | 6.09 | 13.90 | 5.64 | 0.00 | 3.39 |
| 12 | 5.18 | 4.85 | 2.99 | 3.78 | 8.13 | 4.09 | 6.23 | 6.34 | 14.10 | 5.74 | 3.39 | 0.00 |
The table contains RMSD values (calculated on the Cα atoms) between the predicted models.
Read more about the root-mean-square deviation (RMSD) measure.
| # | 1 | 2 | 3 | 4 | 5 | 6 | 7 | 8 | 9 | 10 | 11 | 12 |
| 1 | 1.00 | 0.58 | 0.45 | 0.52 | 0.41 | 0.57 | 0.48 | 0.57 | 0.39 | 0.58 | 0.48 | 0.47 |
| 2 | 0.58 | 1.00 | 0.50 | 0.55 | 0.40 | 0.59 | 0.51 | 0.51 | 0.40 | 0.52 | 0.54 | 0.49 |
| 3 | 0.45 | 0.50 | 1.00 | 0.51 | 0.41 | 0.53 | 0.50 | 0.45 | 0.41 | 0.43 | 0.65 | 0.60 |
| 4 | 0.52 | 0.55 | 0.51 | 1.00 | 0.37 | 0.51 | 0.45 | 0.49 | 0.38 | 0.48 | 0.56 | 0.55 |
| 5 | 0.41 | 0.40 | 0.41 | 0.37 | 1.00 | 0.38 | 0.40 | 0.37 | 0.39 | 0.40 | 0.38 | 0.37 |
| 6 | 0.57 | 0.59 | 0.53 | 0.51 | 0.38 | 1.00 | 0.52 | 0.50 | 0.39 | 0.52 | 0.58 | 0.51 |
| 7 | 0.48 | 0.51 | 0.50 | 0.45 | 0.40 | 0.52 | 1.00 | 0.42 | 0.35 | 0.45 | 0.50 | 0.47 |
| 8 | 0.57 | 0.51 | 0.45 | 0.49 | 0.37 | 0.50 | 0.42 | 1.00 | 0.41 | 0.51 | 0.45 | 0.46 |
| 9 | 0.39 | 0.40 | 0.41 | 0.38 | 0.39 | 0.39 | 0.35 | 0.41 | 1.00 | 0.39 | 0.39 | 0.39 |
| 10 | 0.58 | 0.52 | 0.43 | 0.48 | 0.40 | 0.52 | 0.45 | 0.51 | 0.39 | 1.00 | 0.45 | 0.43 |
| 11 | 0.48 | 0.54 | 0.65 | 0.56 | 0.38 | 0.58 | 0.50 | 0.45 | 0.39 | 0.45 | 1.00 | 0.58 |
| 12 | 0.47 | 0.49 | 0.60 | 0.55 | 0.37 | 0.51 | 0.47 | 0.46 | 0.39 | 0.43 | 0.58 | 1.00 |
The table contains GDT_TS values (calculated on the Cα atoms) between the predicted models.
Read more about the global distance test (GDT, also written as GDT_TS to represent "total score") measure.
© Laboratory of Theory of Biopolymers, Faculty of Chemistry, University of Warsaw 2013