Status: Done started: 2018-Dec-10 07:47:02 UTC
| Project Name | |
| Sequence | VSPPPPIADE PLTVNTGIYL IECYSLDDKA ETFKVNAFLS LSWKDRRLAF DPVRSGVRVK TYEPEAIWIP EIRFVNVENA RDADVVDISV SPDGTVQYLE RFSARVLSPL DFRRYPFDSQ TLHIYLIVRS VDTRNIVLAV DLEKVGKNDD VFLTGWDIES FTAVVKPANF ALEDRLESKL DYQLRISRQY FSYIPNIILP MLFILFISWT AFWSTSYEAN VTLVVSTLIA HIAFNILVET NLPKTPYMTY TGAIIFMIYL FYFVAVIEVT VQHYLKVESQ PARAASITRA SRIAFPVVFL LANIILAFLF F |
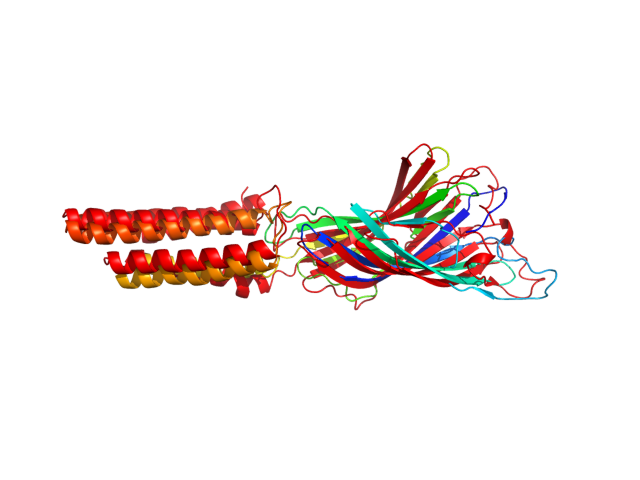
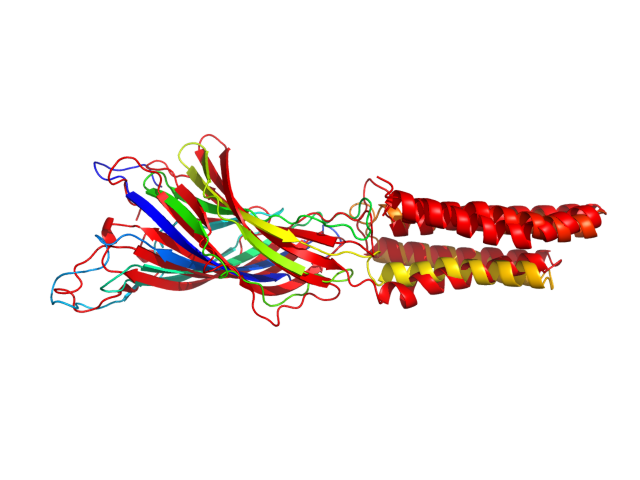
| Secondary structure | CCCCCCCCCC CEEEEEEEEE EEEEEEECCC CEEEEEEEEE EEEECCCCCC CHHHHCCCCE ECCCCCCCCC CCEECCCCCC CEEEEEEEEE CCCCEEEEEE EEEEEEECCC CCCCCCCCEE EEEEEEEEEC CCCCCEEEEE CCCCCEECCC CCCCCEEEEE EEEEEEEEEE ECCCCEEEEE EEEEEEEECC CCHHHHCHHH HHHHHHHHHC CCCCCCHHHH HHHHHHHHHH HHHHHHHHHH HCCCCCCCCH HHHHHHHHHH HHHHHHHHHH HHHHHHHCCC HHHHHHHHHH HHHHHHHHHH HHHHHHHHHH C |
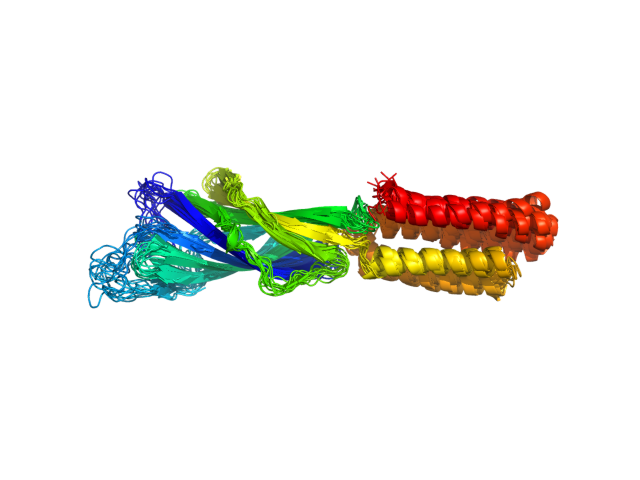
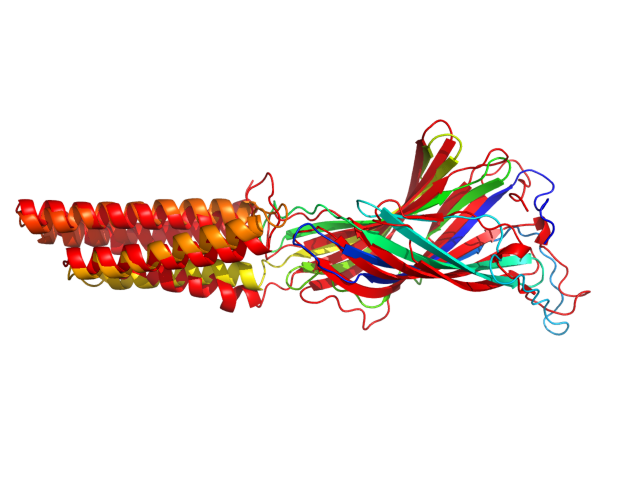
| Movie from predicted structures | To download the movie, right click on the desired file format:  
|
| Estimated finish time | 2018-Dec-10 11:47 UTC |
| Project Name |
| Project Name |
| Cluster # | 1 | 2 | 3 | 4 | 5 | 6 | 7 | 8 | 9 | 10 | 11 | 12 |
| Cluster density | 266.6 | 198.1 | 146.5 | 136.5 | 123.3 | 114.5 | 109.3 | 106.4 | 92.4 | 69.6 | 66.0 | 65.7 |
| Cluster size | 364 | 274 | 197 | 183 | 171 | 158 | 137 | 139 | 118 | 76 | 90 | 93 |
| Average cluster RMSD | 1.4 | 1.4 | 1.3 | 1.3 | 1.4 | 1.4 | 1.3 | 1.3 | 1.3 | 1.1 | 1.4 | 1.4 |
| # | 1 | 2 | 3 | 4 | 5 | 6 | 7 | 8 | 9 | 10 | 11 | 12 |
| RMSD | 4.29 | 3.83 | 3.88 | 3.96 | 3.87 | 3.63 | 4.28 | 4.07 | 3.99 | 3.44 | 3.48 | 3.58 |
| GDT_TS | 0.48 | 0.51 | 0.53 | 0.52 | 0.55 | 0.57 | 0.48 | 0.51 | 0.52 | 0.57 | 0.57 | 0.57 |
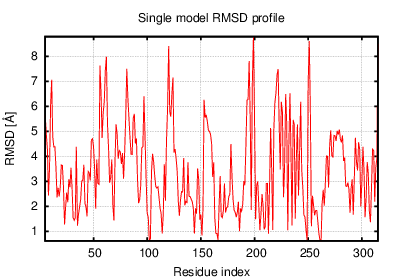
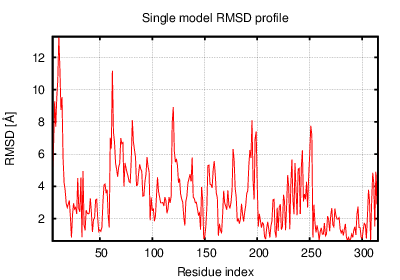
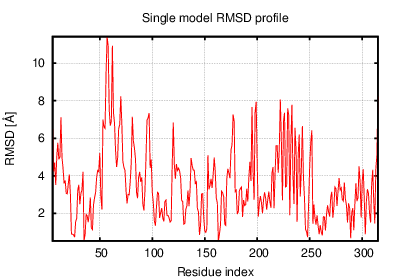
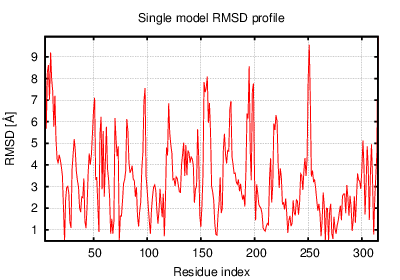
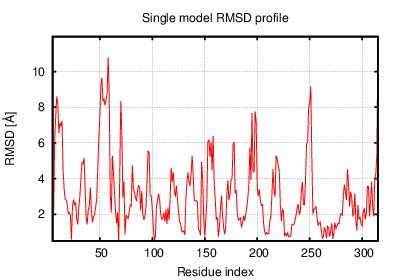
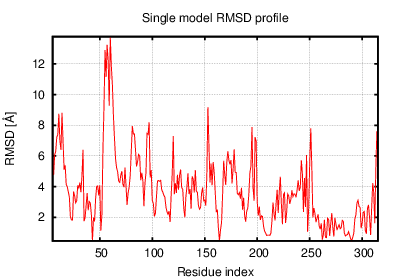
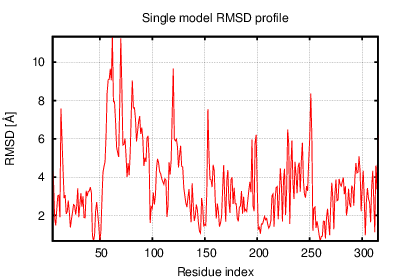
The table contains RMSD and GDT_TS values (calculated on the Cα atoms) between the predicted models and the input structure. Note that GDT_TS metric is intended as a more accurate measurement than the more common RMSD.
Read more about the root-mean-square deviation (RMSD) measure
Read more about the global distance test (GDT, also written as GDT_TS to represent "total score") measure.
| # | 1 | 2 | 3 | 4 | 5 | 6 | 7 | 8 | 9 | 10 | 11 | 12 |
| 1 | 0.00 | 2.41 | 2.52 | 2.32 | 3.52 | 3.75 | 2.55 | 2.27 | 2.64 | 3.23 | 4.30 | 3.71 |
| 2 | 2.41 | 0.00 | 2.29 | 2.31 | 3.19 | 3.61 | 2.13 | 2.33 | 2.25 | 3.00 | 3.82 | 3.38 |
| 3 | 2.52 | 2.29 | 0.00 | 2.72 | 3.42 | 3.41 | 2.89 | 2.28 | 2.64 | 2.60 | 3.70 | 3.17 |
| 4 | 2.32 | 2.31 | 2.72 | 0.00 | 3.32 | 3.78 | 2.25 | 2.24 | 2.27 | 3.26 | 4.18 | 3.86 |
| 5 | 3.52 | 3.19 | 3.42 | 3.32 | 0.00 | 2.61 | 3.59 | 3.51 | 3.81 | 3.04 | 3.47 | 3.06 |
| 6 | 3.75 | 3.61 | 3.41 | 3.78 | 2.61 | 0.00 | 3.70 | 3.81 | 4.19 | 3.08 | 2.73 | 2.21 |
| 7 | 2.55 | 2.13 | 2.89 | 2.25 | 3.59 | 3.70 | 0.00 | 2.66 | 2.68 | 3.58 | 4.16 | 3.70 |
| 8 | 2.27 | 2.33 | 2.28 | 2.24 | 3.51 | 3.81 | 2.66 | 0.00 | 2.53 | 2.81 | 4.14 | 3.72 |
| 9 | 2.64 | 2.25 | 2.64 | 2.27 | 3.81 | 4.19 | 2.68 | 2.53 | 0.00 | 3.29 | 4.26 | 3.87 |
| 10 | 3.23 | 3.00 | 2.60 | 3.26 | 3.04 | 3.08 | 3.58 | 2.81 | 3.29 | 0.00 | 3.30 | 2.93 |
| 11 | 4.30 | 3.82 | 3.70 | 4.18 | 3.47 | 2.73 | 4.16 | 4.14 | 4.26 | 3.30 | 0.00 | 2.57 |
| 12 | 3.71 | 3.38 | 3.17 | 3.86 | 3.06 | 2.21 | 3.70 | 3.72 | 3.87 | 2.93 | 2.57 | 0.00 |
The table contains RMSD values (calculated on the Cα atoms) between the predicted models.
Read more about the root-mean-square deviation (RMSD) measure.
| # | 1 | 2 | 3 | 4 | 5 | 6 | 7 | 8 | 9 | 10 | 11 | 12 |
| 1 | 1.00 | 0.70 | 0.73 | 0.71 | 0.59 | 0.59 | 0.68 | 0.74 | 0.68 | 0.63 | 0.54 | 0.58 |
| 2 | 0.70 | 1.00 | 0.71 | 0.72 | 0.62 | 0.59 | 0.75 | 0.71 | 0.71 | 0.63 | 0.57 | 0.60 |
| 3 | 0.73 | 0.71 | 1.00 | 0.70 | 0.62 | 0.60 | 0.65 | 0.77 | 0.71 | 0.68 | 0.57 | 0.61 |
| 4 | 0.71 | 0.72 | 0.70 | 1.00 | 0.61 | 0.59 | 0.74 | 0.77 | 0.71 | 0.62 | 0.58 | 0.59 |
| 5 | 0.59 | 0.62 | 0.62 | 0.61 | 1.00 | 0.74 | 0.61 | 0.62 | 0.58 | 0.69 | 0.67 | 0.72 |
| 6 | 0.59 | 0.59 | 0.60 | 0.59 | 0.74 | 1.00 | 0.57 | 0.59 | 0.56 | 0.70 | 0.72 | 0.78 |
| 7 | 0.68 | 0.75 | 0.65 | 0.74 | 0.61 | 0.57 | 1.00 | 0.67 | 0.68 | 0.59 | 0.55 | 0.58 |
| 8 | 0.74 | 0.71 | 0.77 | 0.77 | 0.62 | 0.59 | 0.67 | 1.00 | 0.70 | 0.66 | 0.54 | 0.62 |
| 9 | 0.68 | 0.71 | 0.71 | 0.71 | 0.58 | 0.56 | 0.68 | 0.70 | 1.00 | 0.61 | 0.55 | 0.56 |
| 10 | 0.63 | 0.63 | 0.68 | 0.62 | 0.69 | 0.70 | 0.59 | 0.66 | 0.61 | 1.00 | 0.64 | 0.71 |
| 11 | 0.54 | 0.57 | 0.57 | 0.58 | 0.67 | 0.72 | 0.55 | 0.54 | 0.55 | 0.64 | 1.00 | 0.70 |
| 12 | 0.58 | 0.60 | 0.61 | 0.59 | 0.72 | 0.78 | 0.58 | 0.62 | 0.56 | 0.71 | 0.70 | 1.00 |
The table contains GDT_TS values (calculated on the Cα atoms) between the predicted models.
Read more about the global distance test (GDT, also written as GDT_TS to represent "total score") measure.
© Laboratory of Theory of Biopolymers, Faculty of Chemistry, University of Warsaw 2013