Status: Done started: 2018-Sep-24 08:54:36 UTC
| Project Name | |
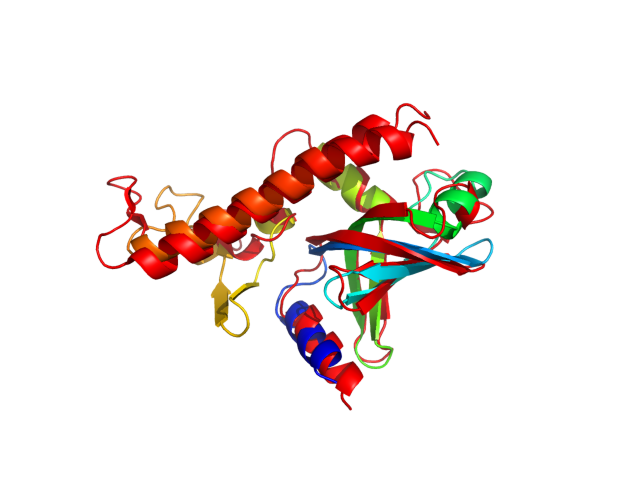
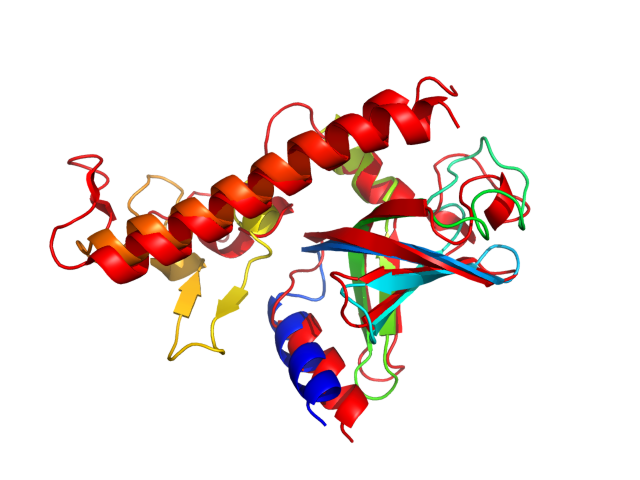
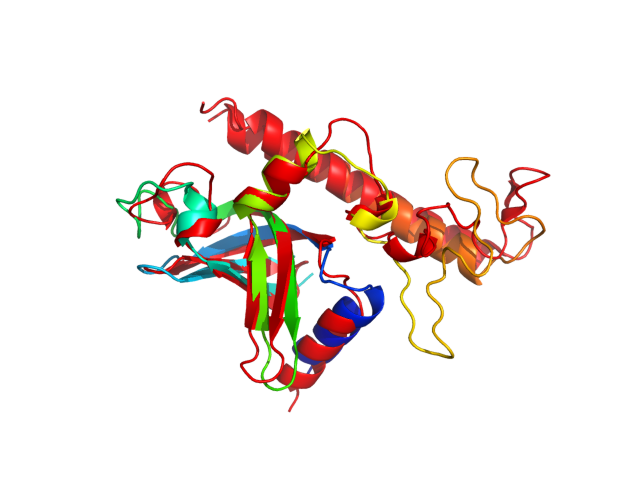
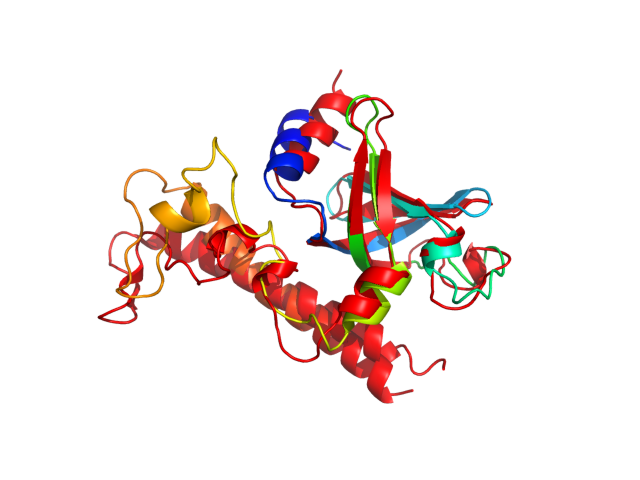
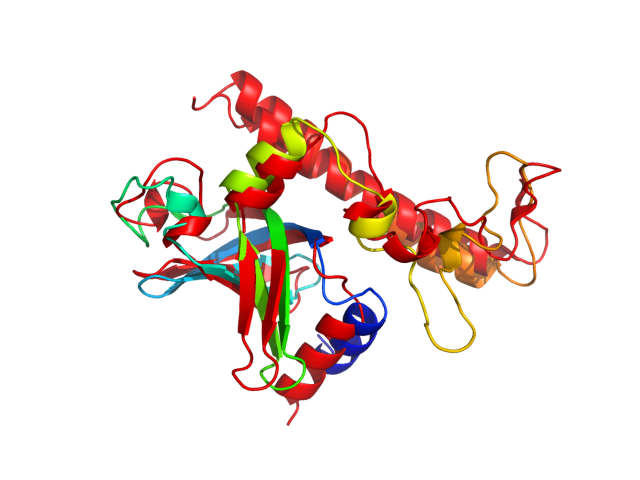
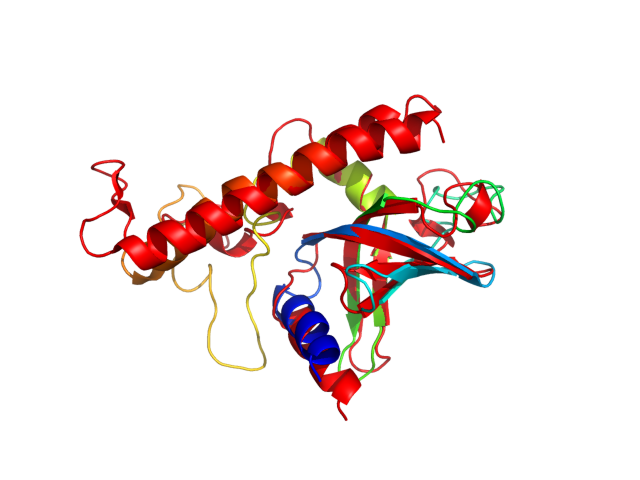
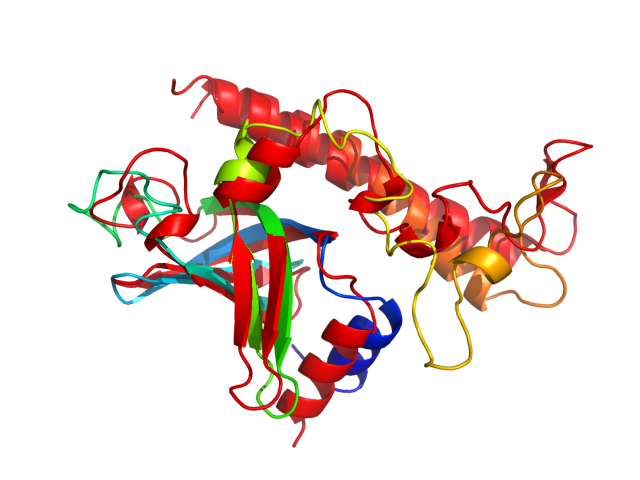
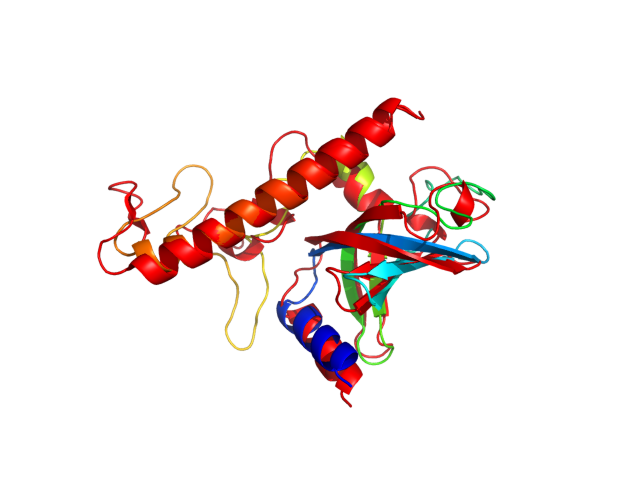
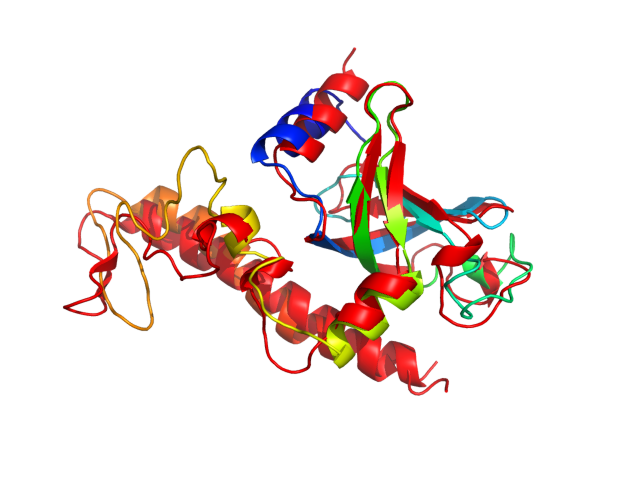
| Sequence | NLYFQHMRHF ARTHAIGQIV PGKVTKLVPF GAFVRVEEGI EGLVHISKLA ERHVEVPDQV VAVGDDAMVK VIDIDLERRR ISLSLKQANE DYTEEFDPAK YGMADSYDEQ GNYIFPEGFD AETNEWLEGF EKQRAEWEAR YAEAERRHKM HTAQMEKFAA A |
| Secondary structure | CHHHHHHHHH HCCCCCCCEE EEEEEEEECC EEEEEECCCE EEEEECCCCC CCCCCCCCCC CCCCCEEEEE EEEEECCCCE EEEEHHHHHH CCCCCCCCCC CCCCCCCCCC CCCCCCCCEE CCCCEECCCC HHHHHHHHHH HHHHHHHHHH HHHHHHCCCC C |
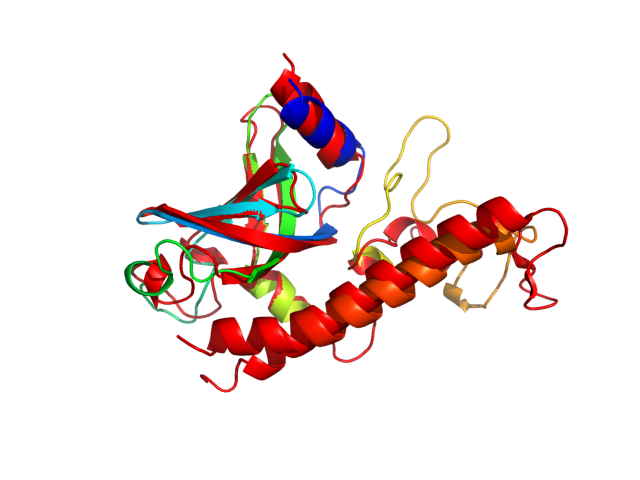
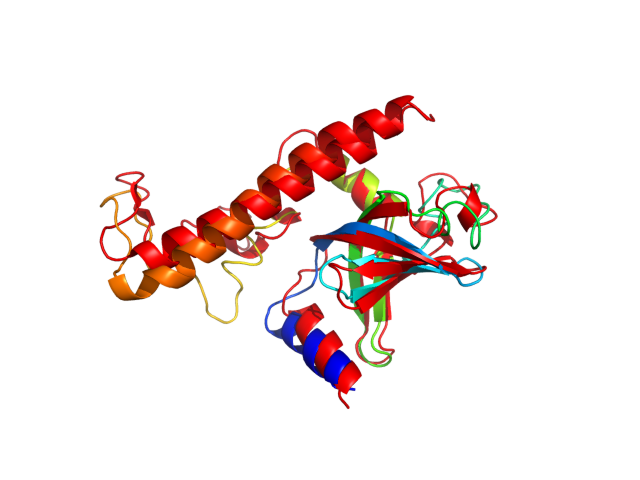
| Movie from predicted structures | To download the movie, right click on the desired file format:  
|
| Estimated finish time | 2018-Sep-24 13:34 UTC |
| Project Name |
| Project Name |
| Cluster # | 1 | 2 | 3 | 4 | 5 | 6 | 7 | 8 | 9 | 10 | 11 | 12 |
| Cluster density | 177.6 | 160.6 | 137.0 | 114.1 | 108.0 | 104.9 | 96.8 | 94.7 | 87.1 | 86.8 | 47.7 | 30.6 |
| Cluster size | 301 | 242 | 218 | 203 | 169 | 169 | 138 | 150 | 133 | 160 | 77 | 40 |
| Average cluster RMSD | 1.7 | 1.5 | 1.6 | 1.8 | 1.6 | 1.6 | 1.4 | 1.6 | 1.5 | 1.8 | 1.6 | 1.3 |
| # | 1 | 2 | 3 | 4 | 5 | 6 | 7 | 8 | 9 | 10 | 11 | 12 |
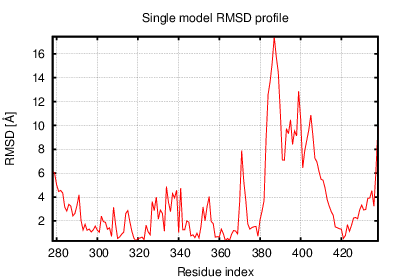
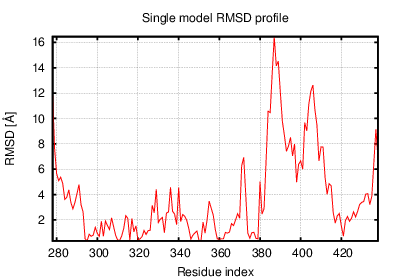
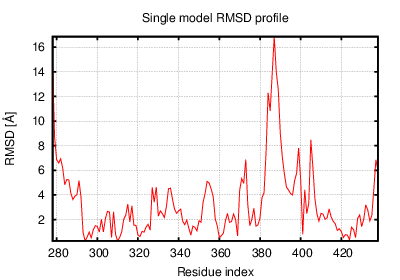
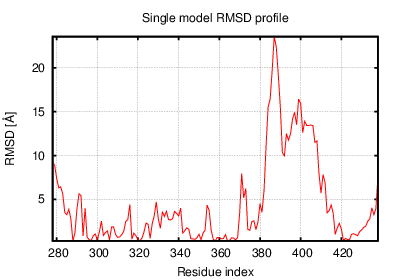
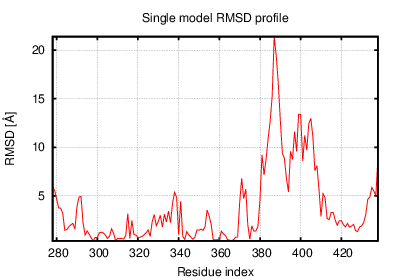
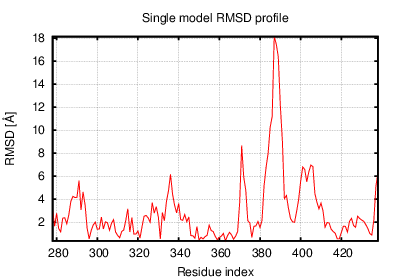
| RMSD | 4.51 | 5.88 | 5.93 | 4.63 | 4.34 | 4.22 | 5.52 | 4.57 | 4.59 | 4.84 | 3.80 | 3.75 |
| GDT_TS | 0.60 | 0.60 | 0.59 | 0.59 | 0.58 | 0.59 | 0.60 | 0.56 | 0.59 | 0.61 | 0.64 | 0.65 |
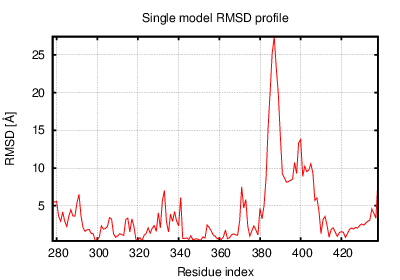
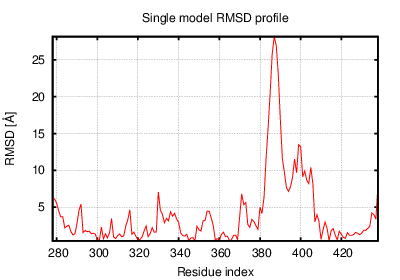
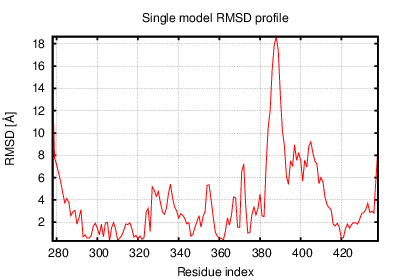
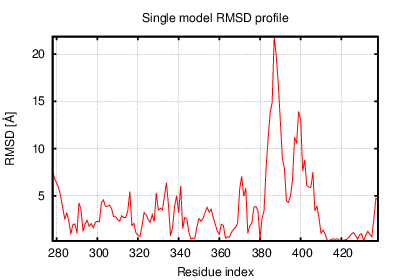
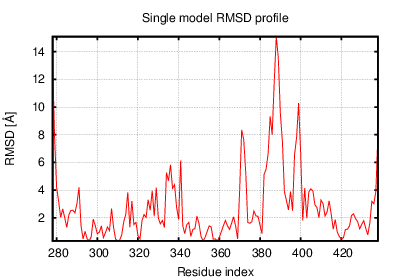
The table contains RMSD and GDT_TS values (calculated on the Cα atoms) between the predicted models and the input structure. Note that GDT_TS metric is intended as a more accurate measurement than the more common RMSD.
Read more about the root-mean-square deviation (RMSD) measure
Read more about the global distance test (GDT, also written as GDT_TS to represent "total score") measure.
| # | 1 | 2 | 3 | 4 | 5 | 6 | 7 | 8 | 9 | 10 | 11 | 12 |
| 1 | 0.00 | 3.99 | 3.71 | 2.48 | 2.71 | 2.33 | 3.11 | 2.83 | 2.51 | 3.05 | 3.69 | 3.12 |
| 2 | 3.99 | 0.00 | 1.92 | 3.95 | 4.67 | 4.66 | 3.47 | 4.46 | 3.74 | 3.25 | 4.76 | 4.47 |
| 3 | 3.71 | 1.92 | 0.00 | 3.74 | 4.54 | 4.45 | 3.13 | 4.20 | 3.61 | 3.09 | 4.67 | 4.47 |
| 4 | 2.48 | 3.95 | 3.74 | 0.00 | 3.03 | 2.72 | 2.54 | 2.92 | 2.58 | 2.62 | 3.97 | 3.06 |
| 5 | 2.71 | 4.67 | 4.54 | 3.03 | 0.00 | 2.13 | 3.72 | 2.26 | 3.71 | 3.86 | 3.27 | 2.73 |
| 6 | 2.33 | 4.66 | 4.45 | 2.72 | 2.13 | 0.00 | 3.83 | 2.51 | 3.51 | 3.69 | 3.16 | 2.51 |
| 7 | 3.11 | 3.47 | 3.13 | 2.54 | 3.72 | 3.83 | 0.00 | 3.42 | 3.00 | 2.35 | 4.71 | 4.13 |
| 8 | 2.83 | 4.46 | 4.20 | 2.92 | 2.26 | 2.51 | 3.42 | 0.00 | 3.40 | 3.73 | 3.51 | 2.85 |
| 9 | 2.51 | 3.74 | 3.61 | 2.58 | 3.71 | 3.51 | 3.00 | 3.40 | 0.00 | 2.89 | 4.30 | 3.43 |
| 10 | 3.05 | 3.25 | 3.09 | 2.62 | 3.86 | 3.69 | 2.35 | 3.73 | 2.89 | 0.00 | 4.28 | 3.66 |
| 11 | 3.69 | 4.76 | 4.67 | 3.97 | 3.27 | 3.16 | 4.71 | 3.51 | 4.30 | 4.28 | 0.00 | 2.43 |
| 12 | 3.12 | 4.47 | 4.47 | 3.06 | 2.73 | 2.51 | 4.13 | 2.85 | 3.43 | 3.66 | 2.43 | 0.00 |
The table contains RMSD values (calculated on the Cα atoms) between the predicted models.
Read more about the root-mean-square deviation (RMSD) measure.
| # | 1 | 2 | 3 | 4 | 5 | 6 | 7 | 8 | 9 | 10 | 11 | 12 |
| 1 | 1.00 | 0.64 | 0.68 | 0.68 | 0.68 | 0.71 | 0.64 | 0.66 | 0.72 | 0.65 | 0.63 | 0.67 |
| 2 | 0.64 | 1.00 | 0.80 | 0.65 | 0.61 | 0.61 | 0.70 | 0.56 | 0.65 | 0.74 | 0.57 | 0.61 |
| 3 | 0.68 | 0.80 | 1.00 | 0.65 | 0.62 | 0.60 | 0.73 | 0.62 | 0.67 | 0.73 | 0.57 | 0.60 |
| 4 | 0.68 | 0.65 | 0.65 | 1.00 | 0.66 | 0.69 | 0.72 | 0.67 | 0.69 | 0.70 | 0.62 | 0.67 |
| 5 | 0.68 | 0.61 | 0.62 | 0.66 | 1.00 | 0.74 | 0.61 | 0.73 | 0.62 | 0.62 | 0.64 | 0.67 |
| 6 | 0.71 | 0.61 | 0.60 | 0.69 | 0.74 | 1.00 | 0.61 | 0.71 | 0.64 | 0.62 | 0.65 | 0.72 |
| 7 | 0.64 | 0.70 | 0.73 | 0.72 | 0.61 | 0.61 | 1.00 | 0.62 | 0.67 | 0.72 | 0.60 | 0.62 |
| 8 | 0.66 | 0.56 | 0.62 | 0.67 | 0.73 | 0.71 | 0.62 | 1.00 | 0.64 | 0.58 | 0.63 | 0.69 |
| 9 | 0.72 | 0.65 | 0.67 | 0.69 | 0.62 | 0.64 | 0.67 | 0.64 | 1.00 | 0.68 | 0.57 | 0.61 |
| 10 | 0.65 | 0.74 | 0.73 | 0.70 | 0.62 | 0.62 | 0.72 | 0.58 | 0.68 | 1.00 | 0.58 | 0.62 |
| 11 | 0.63 | 0.57 | 0.57 | 0.62 | 0.64 | 0.65 | 0.60 | 0.63 | 0.57 | 0.58 | 1.00 | 0.76 |
| 12 | 0.67 | 0.61 | 0.60 | 0.67 | 0.67 | 0.72 | 0.62 | 0.69 | 0.61 | 0.62 | 0.76 | 1.00 |
The table contains GDT_TS values (calculated on the Cα atoms) between the predicted models.
Read more about the global distance test (GDT, also written as GDT_TS to represent "total score") measure.
© Laboratory of Theory of Biopolymers, Faculty of Chemistry, University of Warsaw 2013