Status: Done started: 2018-Mar-14 18:12:15 UTC
| Project Name | 127 |
| Sequence | CGVFGCIASG EWPTQLDVPH VITLGLVGLQ HRGQESAGIV TSDGSSVPTF KSHKGMGLVN HVFTEDNLKK LYVSNLGIGH TRYATTGKCE LENCQPFVVE TLHGKIAVAH NGELVYAARL RKKLLRHGIG LSTSSDSEMI TQLLAYTPPQ EQDDTPDWVA RIKNLMKEAP TAYSLLIMHR DVIYAVRDPY GNRPLCIGRL IPVSDINDKE KKTSETEGWV VSSESCSFLS IGARYYREVL PGEIVEISRH NVQTLDIISR SEGNPVAFCI FEYVYFARPD SMFE |
| Secondary structure | CEEEEEEECC CCCCCCHHHH HHHHHCCCCC CCCCCEEEEE EEECCCCCEE EEEEEECCHH HHCCHHHHHH HCCCCCEEEE EECCCCCCCC CCCCCCEEEE ECCEEEEEEE EECCCCHHHH HHHCCCCCCC CCCCCHHHHH HHHHHHCCCC CCCHHHHHHH HHHHHCCCCE EEEEEECCCC CCCEEEECCC CCCCCEEEEC CCCCCCCCCC CCCCCCCEEE EECCHHHHHH HCCEEEEECC CCCEEEECCC CCCCCCEEEE CCCCCCCCCC CCCCCCCCCC CCCC |
| Movie from predicted structures | To download the movie, right click on the desired file format:  
|
| Estimated finish time | 2018-Mar-14 22:08 UTC |
| Project Name | 127 |
| Project Name | 127 |
| Cluster # | 1 | 2 | 3 | 4 | 5 | 6 | 7 | 8 | 9 | 10 | 11 | 12 |
| Cluster density | 182.2 | 159.0 | 158.3 | 146.8 | 146.2 | 140.6 | 119.9 | 105.2 | 103.5 | 88.9 | 68.3 | 44.7 |
| Cluster size | 264 | 237 | 226 | 199 | 181 | 178 | 160 | 141 | 142 | 125 | 97 | 50 |
| Average cluster RMSD | 1.4 | 1.5 | 1.4 | 1.4 | 1.2 | 1.3 | 1.3 | 1.3 | 1.4 | 1.4 | 1.4 | 1.1 |
| # | 1 | 2 | 3 | 4 | 5 | 6 | 7 | 8 | 9 | 10 | 11 | 12 |
| RMSD | 2.74 | 2.73 | 2.80 | 2.64 | 2.76 | 2.63 | 2.63 | 2.75 | 2.66 | 2.48 | 2.51 | 2.92 |
| GDT_TS | 0.69 | 0.69 | 0.68 | 0.69 | 0.67 | 0.69 | 0.68 | 0.67 | 0.65 | 0.71 | 0.70 | 0.65 |
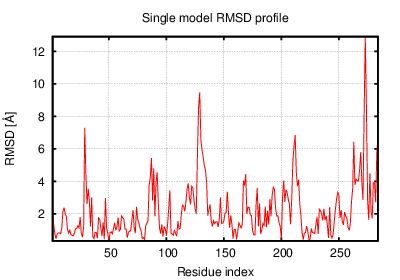
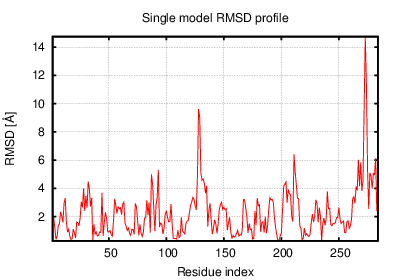
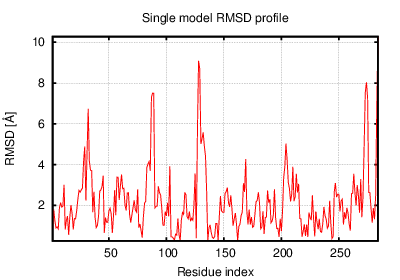
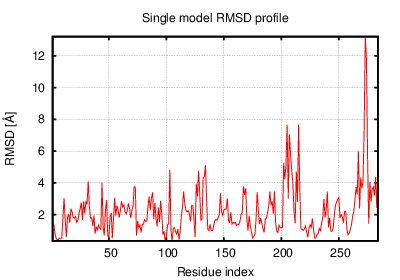
The table contains RMSD and GDT_TS values (calculated on the Cα atoms) between the predicted models and the input structure. Note that GDT_TS metric is intended as a more accurate measurement than the more common RMSD.
Read more about the root-mean-square deviation (RMSD) measure
Read more about the global distance test (GDT, also written as GDT_TS to represent "total score") measure.
| # | 1 | 2 | 3 | 4 | 5 | 6 | 7 | 8 | 9 | 10 | 11 | 12 |
| 1 | 0.00 | 2.71 | 2.54 | 2.25 | 2.84 | 2.55 | 2.76 | 2.69 | 2.36 | 2.35 | 2.36 | 2.84 |
| 2 | 2.71 | 0.00 | 2.14 | 2.66 | 2.13 | 2.25 | 2.52 | 2.38 | 2.96 | 2.48 | 2.66 | 2.89 |
| 3 | 2.54 | 2.14 | 0.00 | 2.35 | 2.18 | 2.23 | 2.22 | 2.52 | 2.61 | 2.52 | 2.39 | 2.52 |
| 4 | 2.25 | 2.66 | 2.35 | 0.00 | 2.63 | 2.56 | 2.27 | 2.89 | 2.41 | 2.18 | 2.14 | 2.43 |
| 5 | 2.84 | 2.13 | 2.18 | 2.63 | 0.00 | 2.31 | 2.37 | 2.38 | 2.80 | 2.48 | 2.47 | 2.81 |
| 6 | 2.55 | 2.25 | 2.23 | 2.56 | 2.31 | 0.00 | 2.42 | 1.97 | 2.52 | 2.23 | 2.70 | 2.84 |
| 7 | 2.76 | 2.52 | 2.22 | 2.27 | 2.37 | 2.42 | 0.00 | 2.73 | 2.44 | 2.14 | 2.41 | 2.00 |
| 8 | 2.69 | 2.38 | 2.52 | 2.89 | 2.38 | 1.97 | 2.73 | 0.00 | 2.52 | 2.60 | 2.89 | 2.91 |
| 9 | 2.36 | 2.96 | 2.61 | 2.41 | 2.80 | 2.52 | 2.44 | 2.52 | 0.00 | 2.42 | 2.51 | 2.56 |
| 10 | 2.35 | 2.48 | 2.52 | 2.18 | 2.48 | 2.23 | 2.14 | 2.60 | 2.42 | 0.00 | 2.20 | 2.32 |
| 11 | 2.36 | 2.66 | 2.39 | 2.14 | 2.47 | 2.70 | 2.41 | 2.89 | 2.51 | 2.20 | 0.00 | 2.59 |
| 12 | 2.84 | 2.89 | 2.52 | 2.43 | 2.81 | 2.84 | 2.00 | 2.91 | 2.56 | 2.32 | 2.59 | 0.00 |
The table contains RMSD values (calculated on the Cα atoms) between the predicted models.
Read more about the root-mean-square deviation (RMSD) measure.
| # | 1 | 2 | 3 | 4 | 5 | 6 | 7 | 8 | 9 | 10 | 11 | 12 |
| 1 | 1.00 | 0.70 | 0.71 | 0.77 | 0.67 | 0.71 | 0.71 | 0.68 | 0.69 | 0.75 | 0.73 | 0.71 |
| 2 | 0.70 | 1.00 | 0.75 | 0.71 | 0.73 | 0.74 | 0.72 | 0.73 | 0.66 | 0.72 | 0.71 | 0.69 |
| 3 | 0.71 | 0.75 | 1.00 | 0.77 | 0.72 | 0.75 | 0.77 | 0.75 | 0.70 | 0.72 | 0.73 | 0.77 |
| 4 | 0.77 | 0.71 | 0.77 | 1.00 | 0.70 | 0.74 | 0.77 | 0.70 | 0.73 | 0.78 | 0.75 | 0.76 |
| 5 | 0.67 | 0.73 | 0.72 | 0.70 | 1.00 | 0.70 | 0.72 | 0.70 | 0.67 | 0.73 | 0.74 | 0.67 |
| 6 | 0.71 | 0.74 | 0.75 | 0.74 | 0.70 | 1.00 | 0.76 | 0.79 | 0.73 | 0.74 | 0.72 | 0.72 |
| 7 | 0.71 | 0.72 | 0.77 | 0.77 | 0.72 | 0.76 | 1.00 | 0.74 | 0.75 | 0.75 | 0.72 | 0.77 |
| 8 | 0.68 | 0.73 | 0.75 | 0.70 | 0.70 | 0.79 | 0.74 | 1.00 | 0.71 | 0.70 | 0.69 | 0.70 |
| 9 | 0.69 | 0.66 | 0.70 | 0.73 | 0.67 | 0.73 | 0.75 | 0.71 | 1.00 | 0.72 | 0.69 | 0.71 |
| 10 | 0.75 | 0.72 | 0.72 | 0.78 | 0.73 | 0.74 | 0.75 | 0.70 | 0.72 | 1.00 | 0.77 | 0.73 |
| 11 | 0.73 | 0.71 | 0.73 | 0.75 | 0.74 | 0.72 | 0.72 | 0.69 | 0.69 | 0.77 | 1.00 | 0.71 |
| 12 | 0.71 | 0.69 | 0.77 | 0.76 | 0.67 | 0.72 | 0.77 | 0.70 | 0.71 | 0.73 | 0.71 | 1.00 |
The table contains GDT_TS values (calculated on the Cα atoms) between the predicted models.
Read more about the global distance test (GDT, also written as GDT_TS to represent "total score") measure.
© Laboratory of Theory of Biopolymers, Faculty of Chemistry, University of Warsaw 2013