Status: Done started: 2018-Jan-11 05:48:16 UTC
| Project Name | madhan |
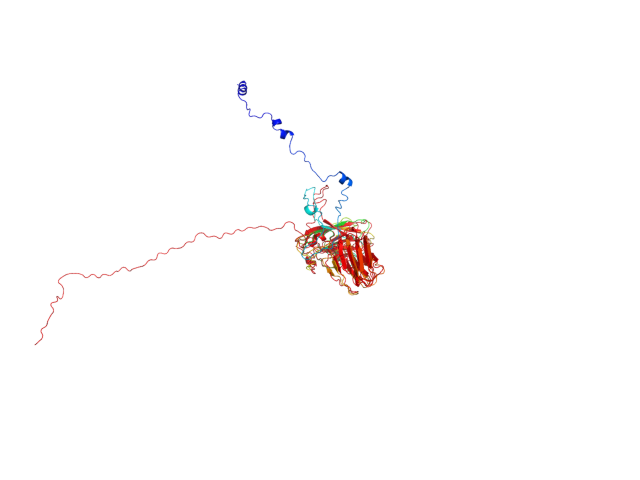
| Sequence | MAMVKRINNL PTVKLAKQAL PLLANPKLVN KAIDVVPLVV QGGRKLSKAA KRLLGAYGGN ISYTEGAKPG AISAPVAISR RVAGMKPRFV RSEGSVKIVH REFIASVLPS SDLTVNNGDV NIGKYRVNPS NNALFTWLQG QAQLYDMYRF TRLRITYIPT TGSTSTGRVS LLWDRDSQDP LPIDRAAISS YAHSADSAPW AENVLVVPCD NTWRYMNDTN AVDRKLVDFG QFLFATYSGA GSTAHGDLYV EYAVEFKDPQ PIAGMVCMFD RLVSLSEVGS TIKGVNYIAD RDVITTGGNI GVNINIPGTY LVTIVLNATS IGPLTFTGNS KLVGNSLNLT SSGASALTFT LNSTGVPNSS DSSFSVGTVV ALTRVRMTIT RCSPETAYLA |
| Secondary structure | CCCCCCCCCC CCCCCCCCCC CCCCCCCCCC CCCCCCCCCC CCCCCCCCCC CCCCCCCCCC CCCCCCCCCC CCCCCCCEEC CCCCCCCCCC CCCCCCCCCE EEEEEEECCC CCEECCCCCC CCCCCCCCCC CCCCCCCCHH HHCCCCEEEE EEEEEEEEEC CCCCCCCCEE EEEECCCCCC CCCCHHHHHH CCEEEEECCC CCEEEECCCC CCCEECCCCC CCCHHHHCCC EEEECEECCC CCCCCEEEEE EEEEEECCCC CCCCCCCCCE EEECCCCCCC CEEEECCCCC EEEEEECCEE EEEECCCEEE EEEEEECCCC CCCCEEEEEC CCEEEEEEEE ECCCCCEEEE EEEEECCCCC EEEEECCCCC CCCCCEEEEE ECCCCCCCCC |
| Movie from predicted structures | To download the movie, right click on the desired file format:  
|
| Estimated finish time | 2018-Jan-11 09:58 UTC |
| Project Name | madhan |

| Project Name | madhan |
| Cluster # | 1 | 2 | 3 | 4 | 5 | 6 | 7 | 8 | 9 | 10 | 11 | 12 |
| Cluster density | 193.4 | 163.9 | 127.0 | 126.9 | 104.7 | 98.7 | 83.8 | 39.3 | 37.6 | 24.6 | 21.9 | 16.0 |
| Cluster size | 338 | 334 | 293 | 211 | 186 | 171 | 142 | 90 | 90 | 61 | 40 | 44 |
| Average cluster RMSD | 1.7 | 2.0 | 2.3 | 1.7 | 1.8 | 1.7 | 1.7 | 2.3 | 2.4 | 2.5 | 1.8 | 2.8 |
| # | 1 | 2 | 3 | 4 | 5 | 6 | 7 | 8 | 9 | 10 | 11 | 12 |
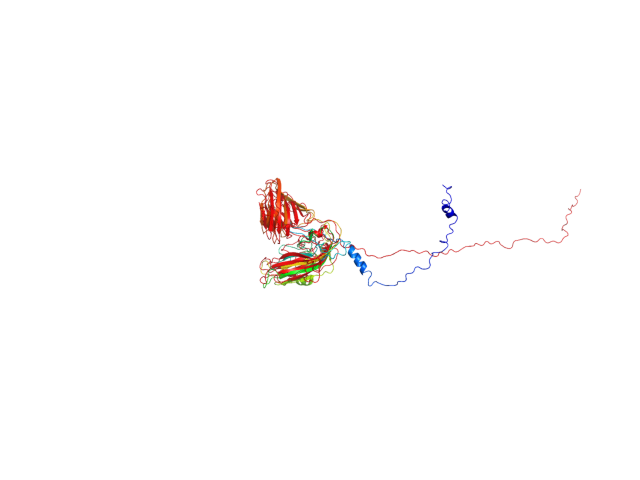
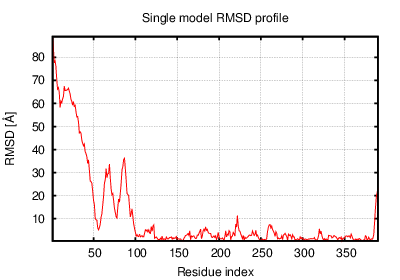
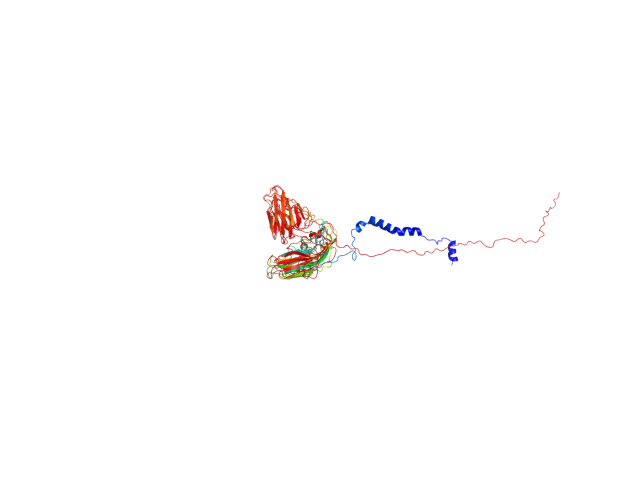
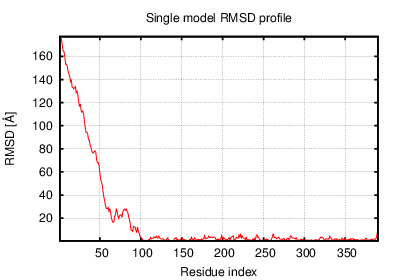
| RMSD | 30.70 | 21.10 | 22.40 | 20.90 | 22.80 | 19.90 | 21.90 | 19.50 | 21.00 | 19.70 | 20.60 | 24.40 |
| GDT_TS | 0.48 | 0.51 | 0.37 | 0.52 | 0.48 | 0.55 | 0.50 | 0.53 | 0.47 | 0.49 | 0.49 | 0.53 |
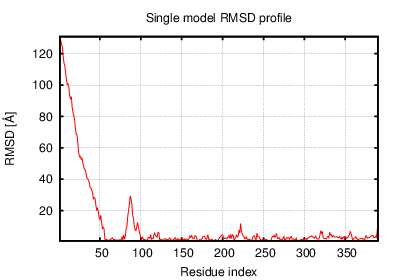
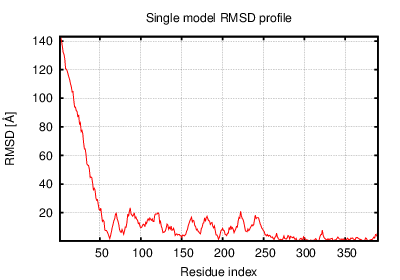
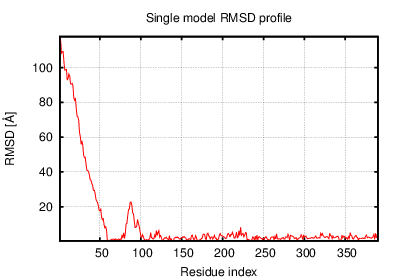
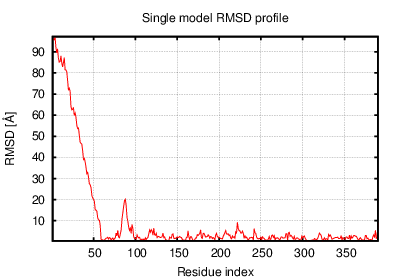
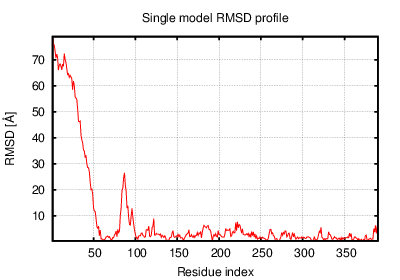
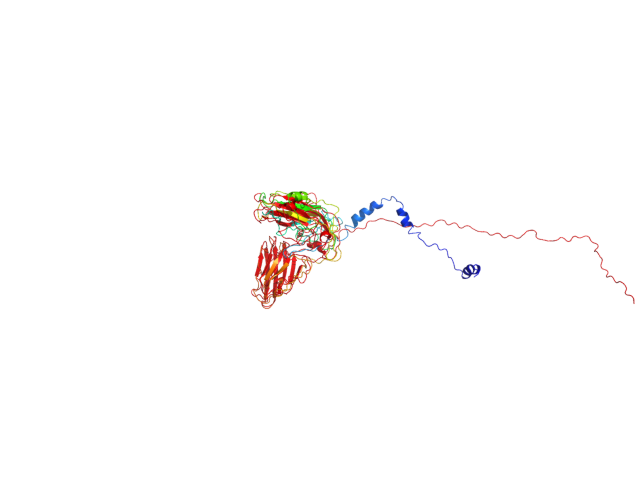
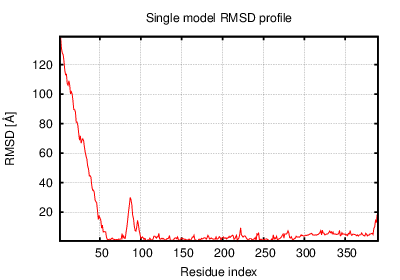
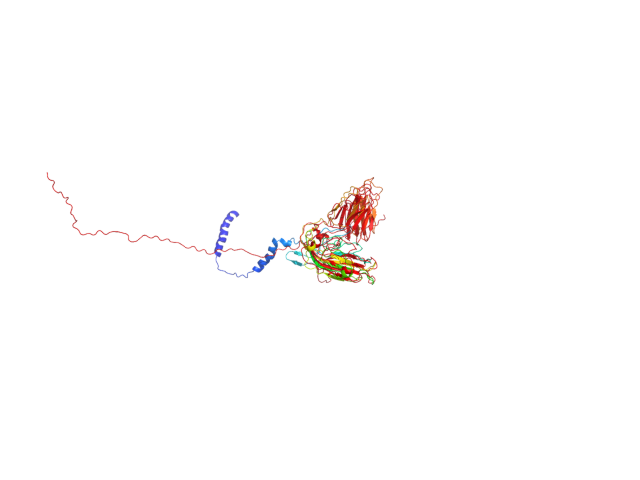
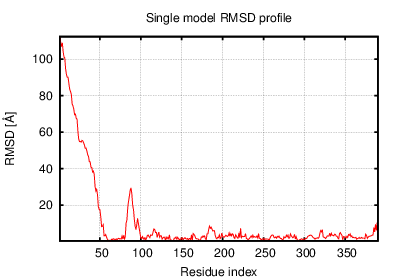
The table contains RMSD and GDT_TS values (calculated on the Cα atoms) between the predicted models and the input structure. Note that GDT_TS metric is intended as a more accurate measurement than the more common RMSD.
Read more about the root-mean-square deviation (RMSD) measure
Read more about the global distance test (GDT, also written as GDT_TS to represent "total score") measure.
| # | 1 | 2 | 3 | 4 | 5 | 6 | 7 | 8 | 9 | 10 | 11 | 12 |
| 1 | 0.00 | 18.00 | 19.40 | 18.30 | 21.60 | 20.90 | 19.20 | 22.70 | 18.00 | 20.20 | 22.40 | 13.70 |
| 2 | 18.00 | 0.00 | 8.42 | 3.91 | 10.70 | 7.49 | 8.07 | 9.19 | 5.85 | 6.80 | 11.90 | 13.80 |
| 3 | 19.40 | 8.42 | 0.00 | 7.82 | 11.10 | 7.91 | 8.27 | 10.90 | 8.75 | 8.83 | 13.90 | 16.00 |
| 4 | 18.30 | 3.91 | 7.82 | 0.00 | 10.10 | 6.12 | 7.42 | 7.86 | 6.23 | 6.74 | 10.90 | 13.50 |
| 5 | 21.60 | 10.70 | 11.10 | 10.10 | 0.00 | 8.46 | 9.18 | 9.59 | 10.90 | 10.10 | 10.10 | 18.40 |
| 6 | 20.90 | 7.49 | 7.91 | 6.12 | 8.46 | 0.00 | 5.17 | 5.77 | 8.11 | 6.51 | 11.00 | 15.90 |
| 7 | 19.20 | 8.07 | 8.27 | 7.42 | 9.18 | 5.17 | 0.00 | 8.89 | 8.86 | 8.46 | 12.40 | 15.90 |
| 8 | 22.70 | 9.19 | 10.90 | 7.86 | 9.59 | 5.77 | 8.89 | 0.00 | 9.55 | 7.01 | 10.40 | 16.20 |
| 9 | 18.00 | 5.85 | 8.75 | 6.23 | 10.90 | 8.11 | 8.86 | 9.55 | 0.00 | 4.91 | 14.10 | 14.40 |
| 10 | 20.20 | 6.80 | 8.83 | 6.74 | 10.10 | 6.51 | 8.46 | 7.01 | 4.91 | 0.00 | 13.00 | 15.00 |
| 11 | 22.40 | 11.90 | 13.90 | 10.90 | 10.10 | 11.00 | 12.40 | 10.40 | 14.10 | 13.00 | 0.00 | 16.80 |
| 12 | 13.70 | 13.80 | 16.00 | 13.50 | 18.40 | 15.90 | 15.90 | 16.20 | 14.40 | 15.00 | 16.80 | 0.00 |
The table contains RMSD values (calculated on the Cα atoms) between the predicted models.
Read more about the root-mean-square deviation (RMSD) measure.
| # | 1 | 2 | 3 | 4 | 5 | 6 | 7 | 8 | 9 | 10 | 11 | 12 |
| 1 | 1.00 | 0.55 | 0.37 | 0.56 | 0.54 | 0.54 | 0.58 | 0.54 | 0.49 | 0.51 | 0.48 | 0.54 |
| 2 | 0.55 | 1.00 | 0.43 | 0.68 | 0.58 | 0.60 | 0.67 | 0.61 | 0.61 | 0.62 | 0.49 | 0.55 |
| 3 | 0.37 | 0.43 | 1.00 | 0.44 | 0.40 | 0.41 | 0.42 | 0.42 | 0.41 | 0.43 | 0.41 | 0.37 |
| 4 | 0.56 | 0.68 | 0.44 | 1.00 | 0.64 | 0.69 | 0.69 | 0.61 | 0.56 | 0.59 | 0.51 | 0.55 |
| 5 | 0.54 | 0.58 | 0.40 | 0.64 | 1.00 | 0.59 | 0.59 | 0.55 | 0.50 | 0.51 | 0.53 | 0.54 |
| 6 | 0.54 | 0.60 | 0.41 | 0.69 | 0.59 | 1.00 | 0.66 | 0.62 | 0.56 | 0.55 | 0.53 | 0.56 |
| 7 | 0.58 | 0.67 | 0.42 | 0.69 | 0.59 | 0.66 | 1.00 | 0.61 | 0.57 | 0.60 | 0.49 | 0.54 |
| 8 | 0.54 | 0.61 | 0.42 | 0.61 | 0.55 | 0.62 | 0.61 | 1.00 | 0.59 | 0.63 | 0.55 | 0.56 |
| 9 | 0.49 | 0.61 | 0.41 | 0.56 | 0.50 | 0.56 | 0.57 | 0.59 | 1.00 | 0.60 | 0.47 | 0.49 |
| 10 | 0.51 | 0.62 | 0.43 | 0.59 | 0.51 | 0.55 | 0.60 | 0.63 | 0.60 | 1.00 | 0.51 | 0.51 |
| 11 | 0.48 | 0.49 | 0.41 | 0.51 | 0.53 | 0.53 | 0.49 | 0.55 | 0.47 | 0.51 | 1.00 | 0.54 |
| 12 | 0.54 | 0.55 | 0.37 | 0.55 | 0.54 | 0.56 | 0.54 | 0.56 | 0.49 | 0.51 | 0.54 | 1.00 |
The table contains GDT_TS values (calculated on the Cα atoms) between the predicted models.
Read more about the global distance test (GDT, also written as GDT_TS to represent "total score") measure.
© Laboratory of Theory of Biopolymers, Faculty of Chemistry, University of Warsaw 2013