Status: Done started: 2018-Mar-17 07:50:33 UTC
| Project Name | 417 |
| Sequence | GQQLAIEAPV DADLVSTVPE SATPAALAYA GKCGLPYVEV LCKNRYVGRT FIQPNMRLRQ LGVAKKFGVL SDNFKGKRIV LVDDSIVRGN TISPIIKLLK ESGAKEVHIR AASPPIKYPC FMGINIPTKE ELIAN |
| Secondary structure | CHHHHHHCCC CCCEEECCCC CCHHHHHHHH HHHCCCCCCC EEECCCCCCC CCCCCHHHHH HCCCCCEEEC HHHHCCCEEE EEECCCCCCC CHHHHHHHHH HCCCCEEEEE ECCCCCCCCC CCCCCCCCCC CCCCC |
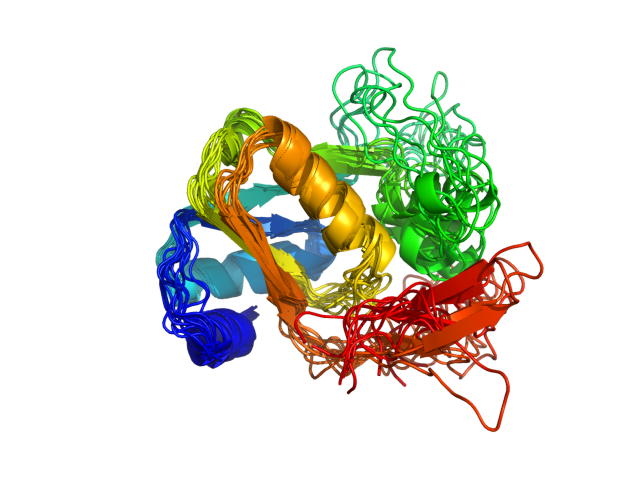
| Movie from predicted structures | To download the movie, right click on the desired file format:  
|
| Estimated finish time | 2018-Mar-17 11:27 UTC |
| Project Name | 417 |

| Project Name | 417 |
| Cluster # | 1 | 2 | 3 | 4 | 5 | 6 | 7 | 8 | 9 | 10 | 11 | 12 |
| Cluster density | 139.4 | 116.5 | 101.2 | 85.1 | 85.1 | 80.8 | 80.8 | 73.8 | 66.6 | 62.7 | 60.3 | 54.8 |
| Cluster size | 240 | 244 | 180 | 168 | 170 | 193 | 142 | 143 | 139 | 114 | 131 | 136 |
| Average cluster RMSD | 1.7 | 2.1 | 1.8 | 2.0 | 2.0 | 2.4 | 1.8 | 1.9 | 2.1 | 1.8 | 2.2 | 2.5 |
| # | 1 | 2 | 3 | 4 | 5 | 6 | 7 | 8 | 9 | 10 | 11 | 12 |
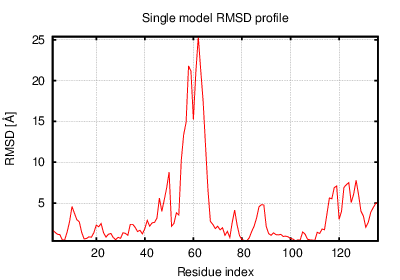
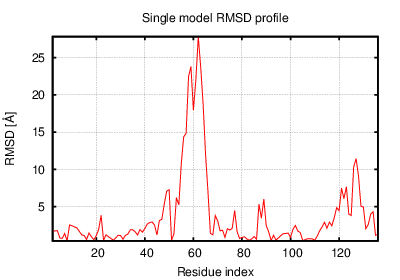
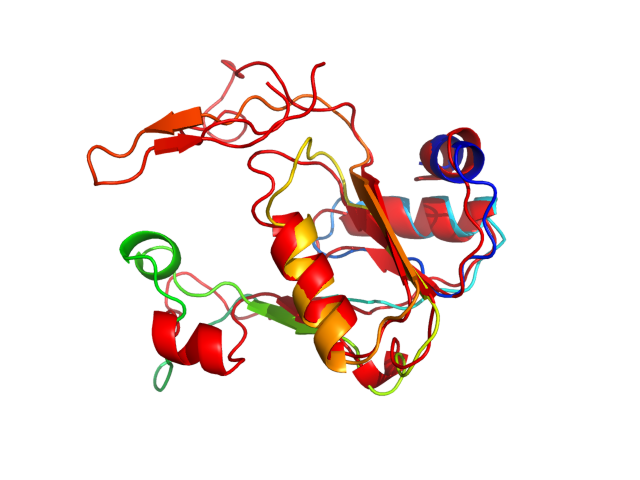
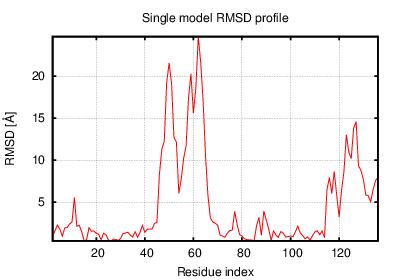
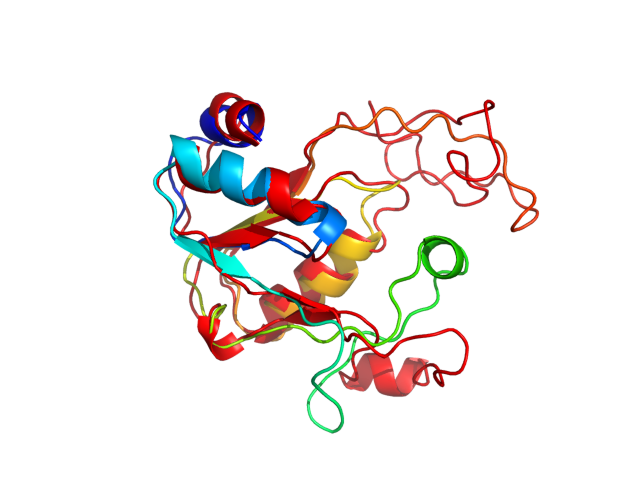
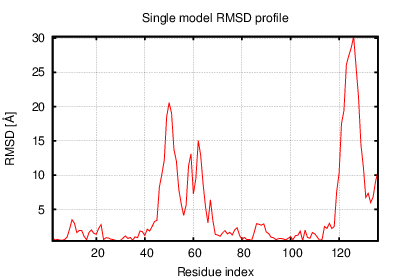
| RMSD | 5.27 | 5.66 | 6.05 | 6.61 | 5.64 | 5.40 | 6.01 | 4.97 | 7.14 | 6.51 | 7.07 | 7.20 |
| GDT_TS | 0.60 | 0.62 | 0.63 | 0.63 | 0.62 | 0.61 | 0.62 | 0.61 | 0.61 | 0.60 | 0.58 | 0.61 |
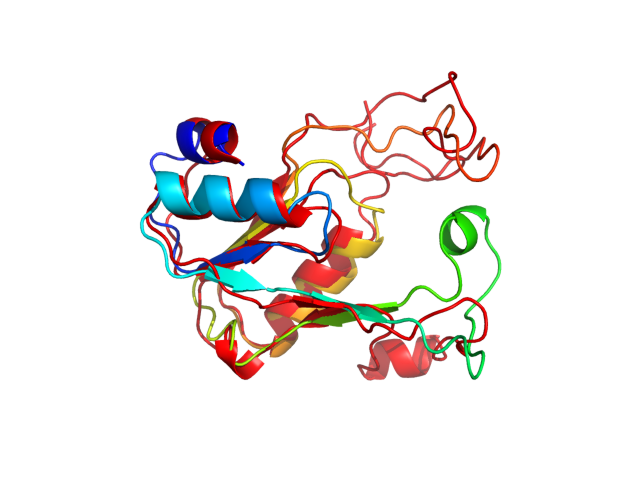
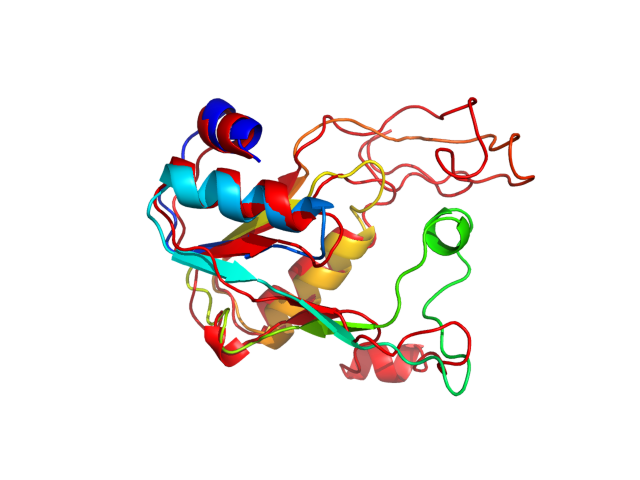
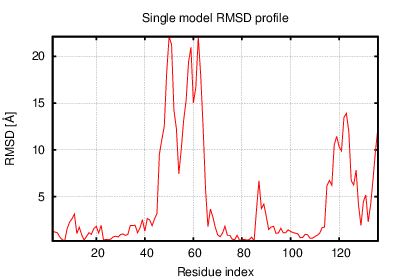
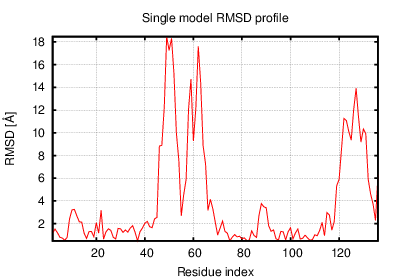
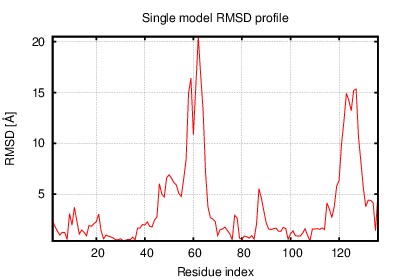
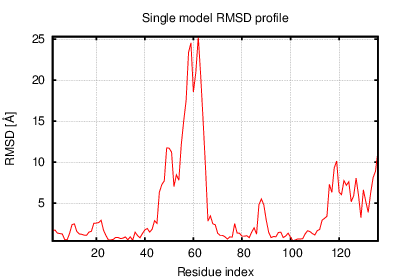
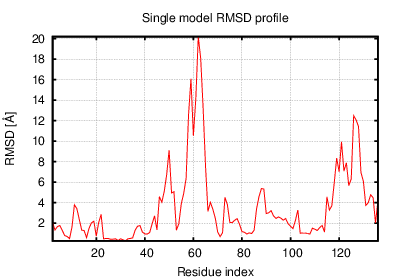
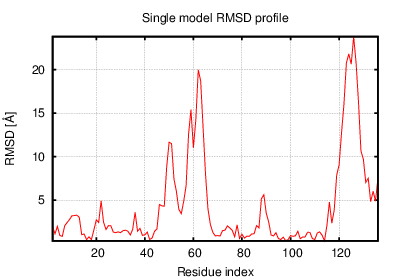
The table contains RMSD and GDT_TS values (calculated on the Cα atoms) between the predicted models and the input structure. Note that GDT_TS metric is intended as a more accurate measurement than the more common RMSD.
Read more about the root-mean-square deviation (RMSD) measure
Read more about the global distance test (GDT, also written as GDT_TS to represent "total score") measure.
| # | 1 | 2 | 3 | 4 | 5 | 6 | 7 | 8 | 9 | 10 | 11 | 12 |
| 1 | 0.00 | 3.07 | 3.49 | 4.01 | 4.16 | 3.81 | 3.01 | 4.09 | 6.53 | 5.37 | 4.81 | 6.29 |
| 2 | 3.07 | 0.00 | 2.41 | 4.34 | 3.91 | 3.03 | 3.04 | 2.96 | 5.95 | 4.20 | 4.45 | 5.64 |
| 3 | 3.49 | 2.41 | 0.00 | 4.39 | 3.86 | 3.30 | 3.26 | 2.99 | 5.39 | 4.24 | 3.97 | 5.31 |
| 4 | 4.01 | 4.34 | 4.39 | 0.00 | 3.65 | 5.01 | 3.17 | 5.28 | 5.71 | 5.70 | 3.21 | 6.11 |
| 5 | 4.16 | 3.91 | 3.86 | 3.65 | 0.00 | 4.00 | 4.15 | 4.01 | 4.34 | 4.14 | 3.27 | 4.10 |
| 6 | 3.81 | 3.03 | 3.30 | 5.01 | 4.00 | 0.00 | 4.00 | 3.01 | 5.85 | 3.63 | 4.71 | 4.99 |
| 7 | 3.01 | 3.04 | 3.26 | 3.17 | 4.15 | 4.00 | 0.00 | 4.20 | 6.10 | 5.40 | 4.35 | 6.27 |
| 8 | 4.09 | 2.96 | 2.99 | 5.28 | 4.01 | 3.01 | 4.20 | 0.00 | 5.27 | 4.01 | 4.88 | 5.06 |
| 9 | 6.53 | 5.95 | 5.39 | 5.71 | 4.34 | 5.85 | 6.10 | 5.27 | 0.00 | 5.00 | 4.50 | 3.43 |
| 10 | 5.37 | 4.20 | 4.24 | 5.70 | 4.14 | 3.63 | 5.40 | 4.01 | 5.00 | 0.00 | 4.51 | 3.66 |
| 11 | 4.81 | 4.45 | 3.97 | 3.21 | 3.27 | 4.71 | 4.35 | 4.88 | 4.50 | 4.51 | 0.00 | 4.57 |
| 12 | 6.29 | 5.64 | 5.31 | 6.11 | 4.10 | 4.99 | 6.27 | 5.06 | 3.43 | 3.66 | 4.57 | 0.00 |
The table contains RMSD values (calculated on the Cα atoms) between the predicted models.
Read more about the root-mean-square deviation (RMSD) measure.
| # | 1 | 2 | 3 | 4 | 5 | 6 | 7 | 8 | 9 | 10 | 11 | 12 |
| 1 | 1.00 | 0.72 | 0.67 | 0.69 | 0.62 | 0.66 | 0.70 | 0.63 | 0.66 | 0.61 | 0.67 | 0.63 |
| 2 | 0.72 | 1.00 | 0.74 | 0.69 | 0.65 | 0.70 | 0.69 | 0.70 | 0.64 | 0.63 | 0.66 | 0.61 |
| 3 | 0.67 | 0.74 | 1.00 | 0.65 | 0.68 | 0.68 | 0.68 | 0.66 | 0.62 | 0.60 | 0.70 | 0.61 |
| 4 | 0.69 | 0.69 | 0.65 | 1.00 | 0.70 | 0.64 | 0.71 | 0.62 | 0.68 | 0.60 | 0.72 | 0.65 |
| 5 | 0.62 | 0.65 | 0.68 | 0.70 | 1.00 | 0.67 | 0.66 | 0.64 | 0.71 | 0.63 | 0.69 | 0.69 |
| 6 | 0.66 | 0.70 | 0.68 | 0.64 | 0.67 | 1.00 | 0.66 | 0.73 | 0.69 | 0.64 | 0.66 | 0.66 |
| 7 | 0.70 | 0.69 | 0.68 | 0.71 | 0.66 | 0.66 | 1.00 | 0.62 | 0.65 | 0.58 | 0.65 | 0.60 |
| 8 | 0.63 | 0.70 | 0.66 | 0.62 | 0.64 | 0.73 | 0.62 | 1.00 | 0.65 | 0.65 | 0.62 | 0.65 |
| 9 | 0.66 | 0.64 | 0.62 | 0.68 | 0.71 | 0.69 | 0.65 | 0.65 | 1.00 | 0.64 | 0.65 | 0.71 |
| 10 | 0.61 | 0.63 | 0.60 | 0.60 | 0.63 | 0.64 | 0.58 | 0.65 | 0.64 | 1.00 | 0.62 | 0.69 |
| 11 | 0.67 | 0.66 | 0.70 | 0.72 | 0.69 | 0.66 | 0.65 | 0.62 | 0.65 | 0.62 | 1.00 | 0.63 |
| 12 | 0.63 | 0.61 | 0.61 | 0.65 | 0.69 | 0.66 | 0.60 | 0.65 | 0.71 | 0.69 | 0.63 | 1.00 |
The table contains GDT_TS values (calculated on the Cα atoms) between the predicted models.
Read more about the global distance test (GDT, also written as GDT_TS to represent "total score") measure.
© Laboratory of Theory of Biopolymers, Faculty of Chemistry, University of Warsaw 2013