Status: Done started: 2018-May-16 06:19:01 UTC
| Project Name | PROJ |
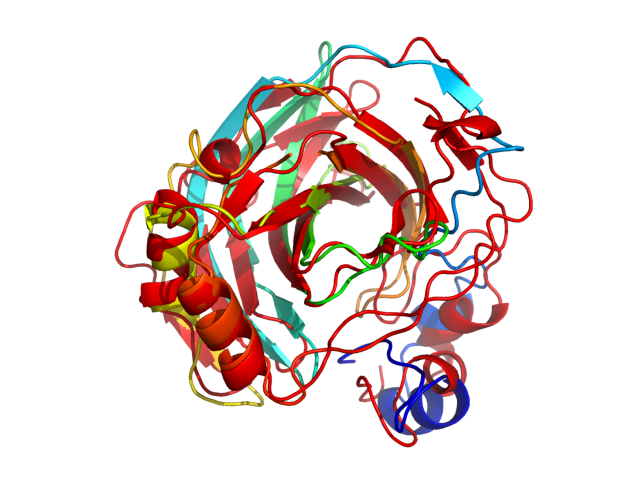
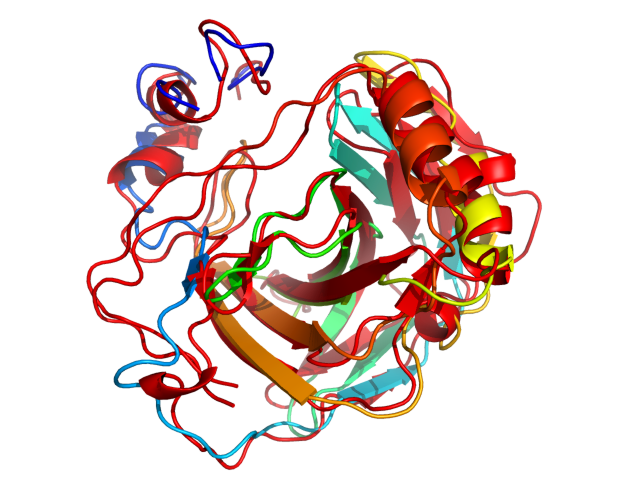
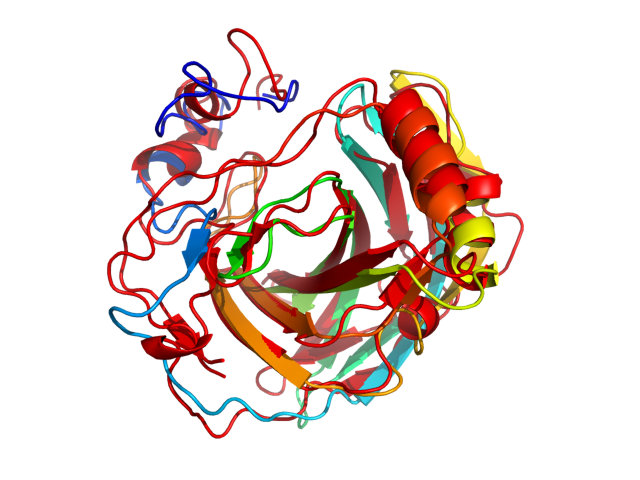
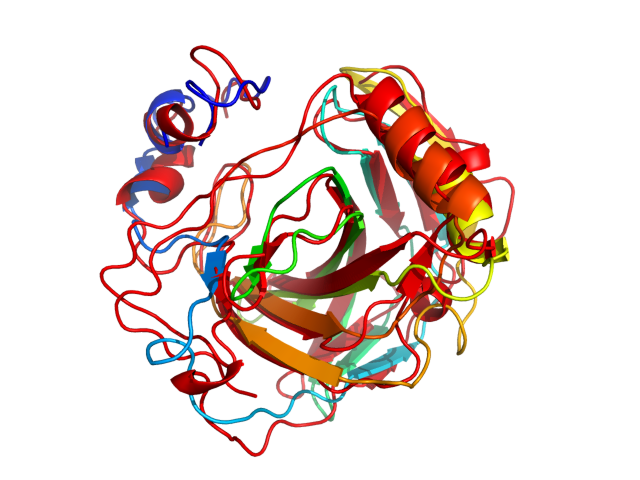
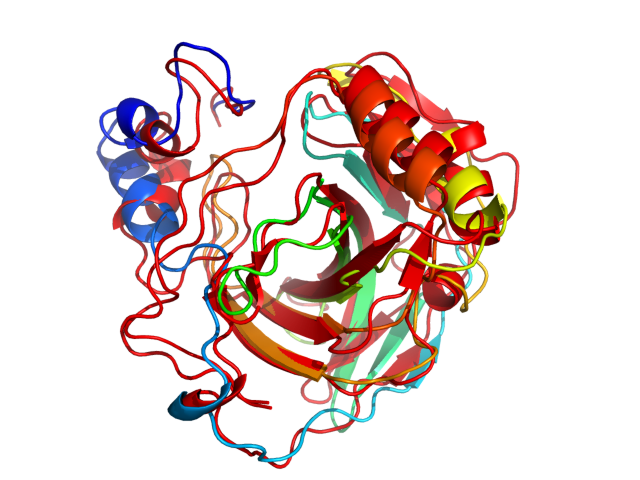
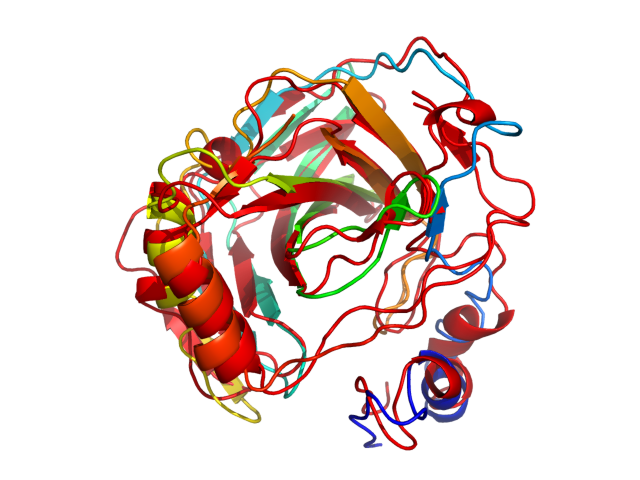
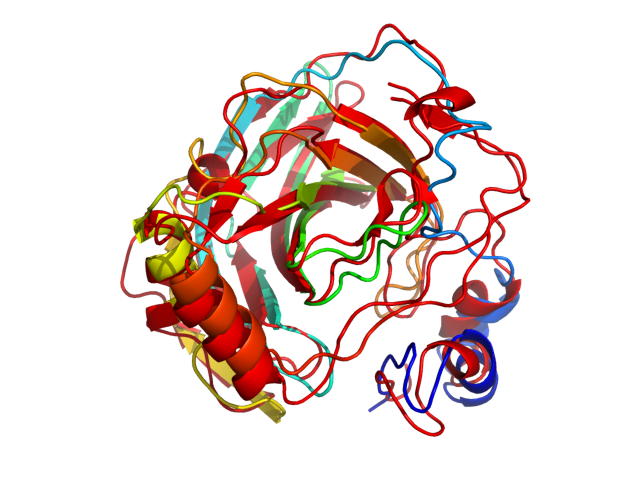
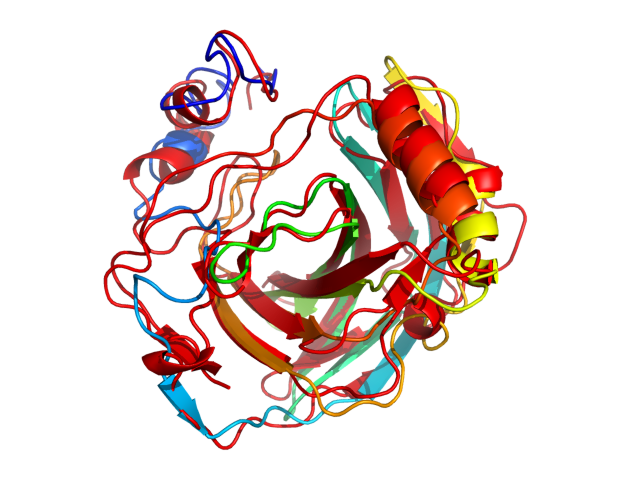
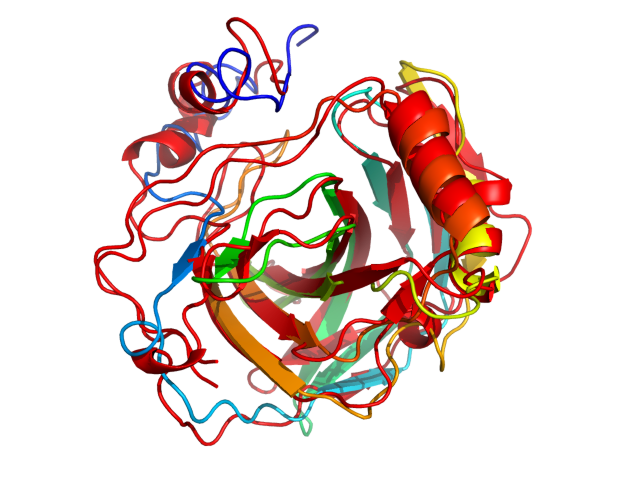
| Sequence | GAHWGYSGSI GPEHWGDLSP EYLMCKIGKN QSPIDINSAD AVKACLAPVS VYYVSDAKYV VNNGHTIKVV MGGRGYVVVD GKRFYLKQFH FHAPSEHTVN GKHYPFEAHF VHLDKNGNIT VLGVFFKVGK ENPELEKVWR VMPEEPGQKR HLTARIDPEK LLPENRDYYR YSGSLTTPPC SEGVRWIVFK EPVEMSREQL EKFRKVMGFD NNRPVQPLNA RKVMK |
| Secondary structure | CCCCCCCCCC CCCCHHHHCC CCHHHHHCCC CCCCEECCCC CCCCCCCCCE EECCCCEEEE EECCCCEEEE ECCCCEEEEC CEEEEEEEEE EECCCCCEEC CEECCEEEEE EEECCCCCEE EEEEEEEECC CCHHHHHHHC CCCCCCCEEE CCCCCCCCCC CCCCCCCEEE EEEECCCCCC CEEEEEEEEC CCEEECHHHH HHHHHHHCCC CCCCCCCCCC CCCCC |
| Movie from predicted structures | To download the movie, right click on the desired file format:  
|
| Estimated finish time | 2018-May-16 11:07 UTC |
| Project Name | PROJ |
| Project Name | PROJ |
| Cluster # | 1 | 2 | 3 | 4 | 5 | 6 | 7 | 8 | 9 | 10 | 11 | 12 |
| Cluster density | 187.8 | 184.9 | 138.3 | 137.4 | 134.8 | 134.4 | 125.3 | 102.3 | 99.9 | 93.7 | 90.8 | 70.9 |
| Cluster size | 269 | 223 | 176 | 184 | 172 | 179 | 162 | 136 | 132 | 133 | 130 | 104 |
| Average cluster RMSD | 1.4 | 1.2 | 1.3 | 1.3 | 1.3 | 1.3 | 1.3 | 1.3 | 1.3 | 1.4 | 1.4 | 1.5 |
| # | 1 | 2 | 3 | 4 | 5 | 6 | 7 | 8 | 9 | 10 | 11 | 12 |
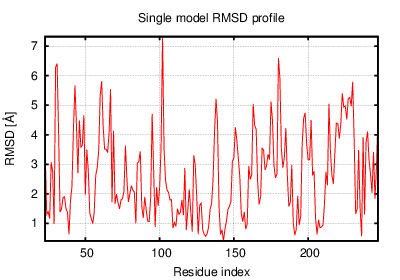
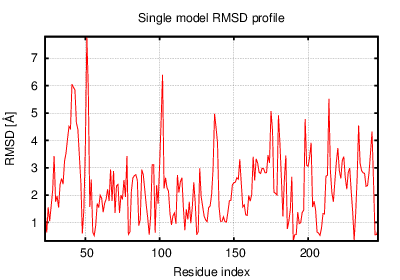
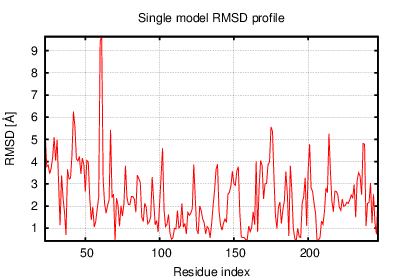
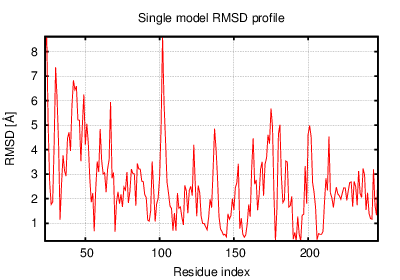
| RMSD | 3.12 | 3.41 | 2.54 | 3.05 | 3.07 | 2.97 | 2.59 | 2.74 | 2.95 | 2.70 | 3.00 | 3.02 |
| GDT_TS | 0.60 | 0.61 | 0.65 | 0.62 | 0.62 | 0.61 | 0.65 | 0.63 | 0.62 | 0.64 | 0.62 | 0.61 |
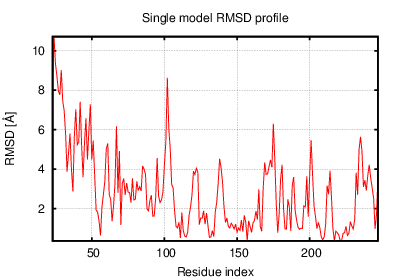
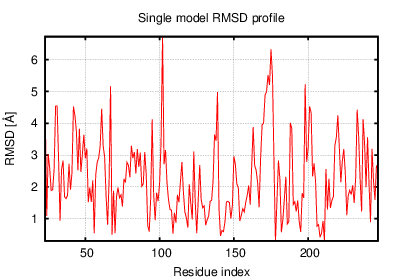
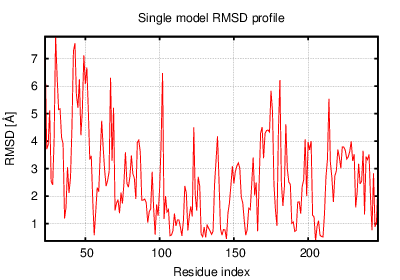
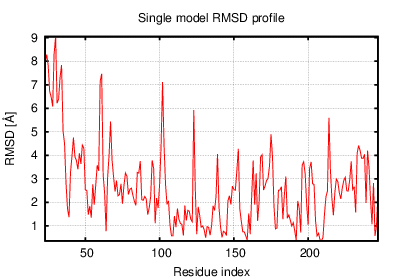
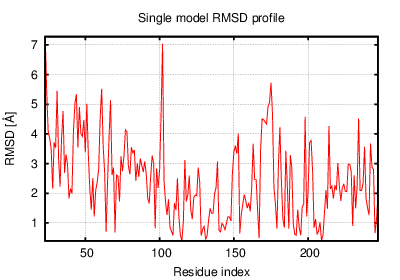
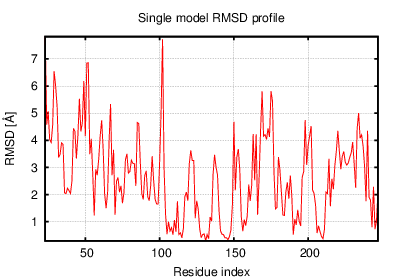
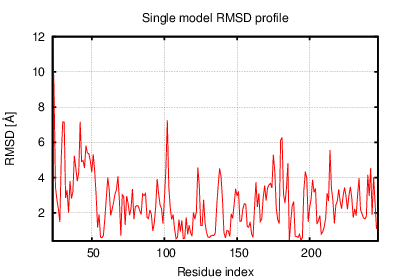
The table contains RMSD and GDT_TS values (calculated on the Cα atoms) between the predicted models and the input structure. Note that GDT_TS metric is intended as a more accurate measurement than the more common RMSD.
Read more about the root-mean-square deviation (RMSD) measure
Read more about the global distance test (GDT, also written as GDT_TS to represent "total score") measure.
| # | 1 | 2 | 3 | 4 | 5 | 6 | 7 | 8 | 9 | 10 | 11 | 12 |
| 1 | 0.00 | 2.24 | 2.41 | 2.08 | 2.29 | 2.66 | 2.97 | 2.14 | 2.18 | 2.04 | 1.93 | 2.15 |
| 2 | 2.24 | 0.00 | 2.66 | 2.58 | 2.34 | 3.07 | 3.33 | 2.65 | 2.38 | 2.31 | 2.41 | 2.63 |
| 3 | 2.41 | 2.66 | 0.00 | 2.22 | 2.46 | 1.91 | 2.11 | 1.98 | 2.07 | 2.12 | 2.17 | 2.33 |
| 4 | 2.08 | 2.58 | 2.22 | 0.00 | 2.18 | 2.08 | 3.03 | 2.01 | 1.82 | 2.07 | 1.84 | 1.88 |
| 5 | 2.29 | 2.34 | 2.46 | 2.18 | 0.00 | 2.36 | 3.14 | 2.31 | 2.07 | 1.85 | 2.13 | 2.30 |
| 6 | 2.66 | 3.07 | 1.91 | 2.08 | 2.36 | 0.00 | 2.57 | 2.08 | 2.09 | 2.26 | 2.22 | 2.21 |
| 7 | 2.97 | 3.33 | 2.11 | 3.03 | 3.14 | 2.57 | 0.00 | 2.54 | 2.70 | 2.73 | 2.99 | 2.92 |
| 8 | 2.14 | 2.65 | 1.98 | 2.01 | 2.31 | 2.08 | 2.54 | 0.00 | 2.01 | 1.91 | 1.70 | 1.93 |
| 9 | 2.18 | 2.38 | 2.07 | 1.82 | 2.07 | 2.09 | 2.70 | 2.01 | 0.00 | 1.87 | 1.93 | 1.98 |
| 10 | 2.04 | 2.31 | 2.12 | 2.07 | 1.85 | 2.26 | 2.73 | 1.91 | 1.87 | 0.00 | 1.96 | 2.00 |
| 11 | 1.93 | 2.41 | 2.17 | 1.84 | 2.13 | 2.22 | 2.99 | 1.70 | 1.93 | 1.96 | 0.00 | 1.81 |
| 12 | 2.15 | 2.63 | 2.33 | 1.88 | 2.30 | 2.21 | 2.92 | 1.93 | 1.98 | 2.00 | 1.81 | 0.00 |
The table contains RMSD values (calculated on the Cα atoms) between the predicted models.
Read more about the root-mean-square deviation (RMSD) measure.
| # | 1 | 2 | 3 | 4 | 5 | 6 | 7 | 8 | 9 | 10 | 11 | 12 |
| 1 | 1.00 | 0.74 | 0.71 | 0.76 | 0.76 | 0.69 | 0.70 | 0.74 | 0.71 | 0.76 | 0.77 | 0.76 |
| 2 | 0.74 | 1.00 | 0.71 | 0.73 | 0.76 | 0.68 | 0.68 | 0.73 | 0.72 | 0.78 | 0.78 | 0.71 |
| 3 | 0.71 | 0.71 | 1.00 | 0.72 | 0.71 | 0.75 | 0.76 | 0.76 | 0.74 | 0.72 | 0.74 | 0.72 |
| 4 | 0.76 | 0.73 | 0.72 | 1.00 | 0.79 | 0.74 | 0.68 | 0.77 | 0.77 | 0.78 | 0.79 | 0.77 |
| 5 | 0.76 | 0.76 | 0.71 | 0.79 | 1.00 | 0.75 | 0.69 | 0.76 | 0.76 | 0.80 | 0.78 | 0.77 |
| 6 | 0.69 | 0.68 | 0.75 | 0.74 | 0.75 | 1.00 | 0.72 | 0.74 | 0.75 | 0.72 | 0.75 | 0.74 |
| 7 | 0.70 | 0.68 | 0.76 | 0.68 | 0.69 | 0.72 | 1.00 | 0.72 | 0.71 | 0.72 | 0.70 | 0.73 |
| 8 | 0.74 | 0.73 | 0.76 | 0.77 | 0.76 | 0.74 | 0.72 | 1.00 | 0.76 | 0.77 | 0.82 | 0.76 |
| 9 | 0.71 | 0.72 | 0.74 | 0.77 | 0.76 | 0.75 | 0.71 | 0.76 | 1.00 | 0.78 | 0.78 | 0.74 |
| 10 | 0.76 | 0.78 | 0.72 | 0.78 | 0.80 | 0.72 | 0.72 | 0.77 | 0.78 | 1.00 | 0.77 | 0.78 |
| 11 | 0.77 | 0.78 | 0.74 | 0.79 | 0.78 | 0.75 | 0.70 | 0.82 | 0.78 | 0.77 | 1.00 | 0.77 |
| 12 | 0.76 | 0.71 | 0.72 | 0.77 | 0.77 | 0.74 | 0.73 | 0.76 | 0.74 | 0.78 | 0.77 | 1.00 |
The table contains GDT_TS values (calculated on the Cα atoms) between the predicted models.
Read more about the global distance test (GDT, also written as GDT_TS to represent "total score") measure.
© Laboratory of Theory of Biopolymers, Faculty of Chemistry, University of Warsaw 2013