Status: Done started: 2018-Dec-27 02:45:01 UTC
| Project Name | |
| Sequence | KDTIALVVST LNNPFFVSLK DGAQKEADKL GYNLVVLDSQ NNPAKELANV QDLTVRGTKI LLINPTDSDA VGNAVKMANQ ANIPVITLDR QATKGEVVSH IASDNVLGGK IAGDYIAKKA GEGAKVIELQ GIAGTSAARE RGEGFQQAVA AHKFNVLASQ PADFDRIKGL NVMQNLLTAH PDVQAVFAQN DEMALGALRA LQTAGKSDVM VVGFDGTPDG EKAVNDGKLA ATIAQLPDQI GAKGVETADK VLKGEKVQAK YPVDLKLVVK Q |
| Secondary structure | CCEEEEEECC CCCHHHHHHH HHHHHHHHHH CCEEEEEECC CCHHHHHHHH HHHHHCCCCE EEECCCCCCC CHHHHHHHHH HCCCEEEECC CCCCCCCCEE ECCCHHHHHH HHHHHHHHHH CCCCEEEEEE CCCCCHHHHH HHHHHHHHHH HCCCEEEEEE ECCCCHHHHH HHHHHHHHHC CCCCEEEECC HHHHHHHHHH HHHHCCCCCE EECCCCCHHH HHHHHCCCCC CEEECCHHHH HHHHHHHHHH HHCCCCCCCC CCCCCEEECC C |
| Movie from predicted structures | To download the movie, right click on the desired file format:  
|
| Estimated finish time | 2018-Dec-27 06:39 UTC |
| Project Name |


| Project Name |
| Cluster # | 1 | 2 | 3 | 4 | 5 | 6 | 7 | 8 | 9 | 10 | 11 | 12 |
| Cluster density | 333.2 | 308.0 | 166.6 | 141.8 | 115.5 | 114.8 | 114.4 | 104.6 | 95.2 | 89.9 | 88.2 | 55.1 |
| Cluster size | 404 | 365 | 190 | 164 | 143 | 124 | 128 | 113 | 107 | 98 | 101 | 63 |
| Average cluster RMSD | 1.2 | 1.2 | 1.1 | 1.2 | 1.2 | 1.1 | 1.1 | 1.1 | 1.1 | 1.1 | 1.1 | 1.1 |
| # | 1 | 2 | 3 | 4 | 5 | 6 | 7 | 8 | 9 | 10 | 11 | 12 |
| RMSD | 2.10 | 2.46 | 2.25 | 2.22 | 2.24 | 2.20 | 2.34 | 2.26 | 2.52 | 2.32 | 2.18 | 2.16 |
| GDT_TS | 0.74 | 0.70 | 0.74 | 0.73 | 0.73 | 0.73 | 0.72 | 0.72 | 0.68 | 0.72 | 0.74 | 0.74 |
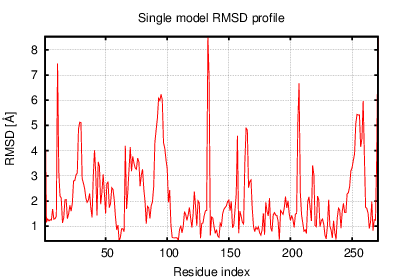
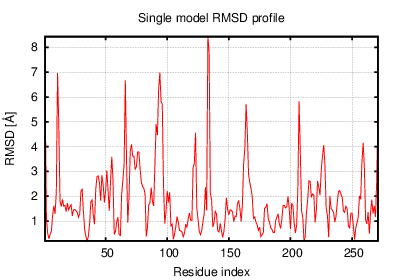
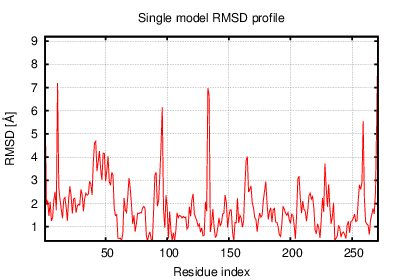
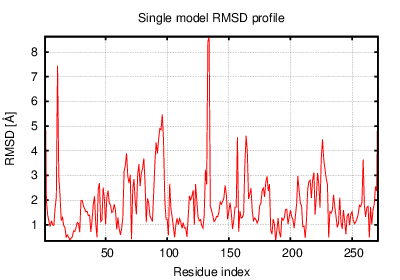
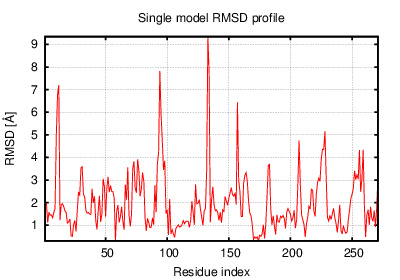
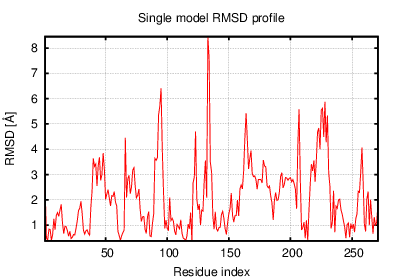
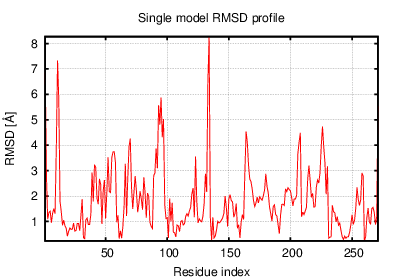
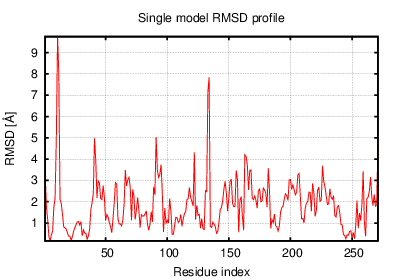
The table contains RMSD and GDT_TS values (calculated on the Cα atoms) between the predicted models and the input structure. Note that GDT_TS metric is intended as a more accurate measurement than the more common RMSD.
Read more about the root-mean-square deviation (RMSD) measure
Read more about the global distance test (GDT, also written as GDT_TS to represent "total score") measure.
| # | 1 | 2 | 3 | 4 | 5 | 6 | 7 | 8 | 9 | 10 | 11 | 12 |
| 1 | 0.00 | 2.00 | 1.78 | 1.96 | 1.69 | 1.72 | 1.76 | 1.83 | 2.15 | 1.94 | 1.74 | 1.87 |
| 2 | 2.00 | 0.00 | 2.25 | 1.82 | 1.55 | 1.55 | 1.91 | 1.89 | 1.75 | 1.98 | 2.03 | 1.96 |
| 3 | 1.78 | 2.25 | 0.00 | 2.38 | 2.24 | 1.95 | 2.11 | 2.03 | 2.53 | 2.15 | 2.10 | 2.19 |
| 4 | 1.96 | 1.82 | 2.38 | 0.00 | 1.74 | 1.97 | 2.19 | 2.30 | 1.81 | 2.23 | 1.87 | 1.87 |
| 5 | 1.69 | 1.55 | 2.24 | 1.74 | 0.00 | 1.69 | 1.89 | 1.86 | 1.70 | 2.13 | 1.86 | 1.68 |
| 6 | 1.72 | 1.55 | 1.95 | 1.97 | 1.69 | 0.00 | 1.74 | 1.74 | 1.92 | 1.78 | 1.74 | 1.77 |
| 7 | 1.76 | 1.91 | 2.11 | 2.19 | 1.89 | 1.74 | 0.00 | 1.97 | 2.15 | 2.04 | 2.00 | 1.91 |
| 8 | 1.83 | 1.89 | 2.03 | 2.30 | 1.86 | 1.74 | 1.97 | 0.00 | 1.96 | 1.86 | 2.05 | 1.98 |
| 9 | 2.15 | 1.75 | 2.53 | 1.81 | 1.70 | 1.92 | 2.15 | 1.96 | 0.00 | 2.08 | 2.31 | 1.91 |
| 10 | 1.94 | 1.98 | 2.15 | 2.23 | 2.13 | 1.78 | 2.04 | 1.86 | 2.08 | 0.00 | 1.96 | 1.90 |
| 11 | 1.74 | 2.03 | 2.10 | 1.87 | 1.86 | 1.74 | 2.00 | 2.05 | 2.31 | 1.96 | 0.00 | 1.88 |
| 12 | 1.87 | 1.96 | 2.19 | 1.87 | 1.68 | 1.77 | 1.91 | 1.98 | 1.91 | 1.90 | 1.88 | 0.00 |
The table contains RMSD values (calculated on the Cα atoms) between the predicted models.
Read more about the root-mean-square deviation (RMSD) measure.
| # | 1 | 2 | 3 | 4 | 5 | 6 | 7 | 8 | 9 | 10 | 11 | 12 |
| 1 | 1.00 | 0.78 | 0.78 | 0.77 | 0.81 | 0.82 | 0.79 | 0.77 | 0.73 | 0.76 | 0.81 | 0.78 |
| 2 | 0.78 | 1.00 | 0.70 | 0.79 | 0.83 | 0.81 | 0.77 | 0.77 | 0.80 | 0.75 | 0.75 | 0.77 |
| 3 | 0.78 | 0.70 | 1.00 | 0.71 | 0.72 | 0.74 | 0.72 | 0.74 | 0.68 | 0.72 | 0.72 | 0.72 |
| 4 | 0.77 | 0.79 | 0.71 | 1.00 | 0.81 | 0.77 | 0.73 | 0.73 | 0.78 | 0.76 | 0.82 | 0.79 |
| 5 | 0.81 | 0.83 | 0.72 | 0.81 | 1.00 | 0.80 | 0.78 | 0.77 | 0.80 | 0.74 | 0.77 | 0.81 |
| 6 | 0.82 | 0.81 | 0.74 | 0.77 | 0.80 | 1.00 | 0.79 | 0.79 | 0.78 | 0.79 | 0.80 | 0.79 |
| 7 | 0.79 | 0.77 | 0.72 | 0.73 | 0.78 | 0.79 | 1.00 | 0.77 | 0.73 | 0.74 | 0.75 | 0.76 |
| 8 | 0.77 | 0.77 | 0.74 | 0.73 | 0.77 | 0.79 | 0.77 | 1.00 | 0.76 | 0.77 | 0.74 | 0.76 |
| 9 | 0.73 | 0.80 | 0.68 | 0.78 | 0.80 | 0.78 | 0.73 | 0.76 | 1.00 | 0.75 | 0.72 | 0.77 |
| 10 | 0.76 | 0.75 | 0.72 | 0.76 | 0.74 | 0.79 | 0.74 | 0.77 | 0.75 | 1.00 | 0.76 | 0.76 |
| 11 | 0.81 | 0.75 | 0.72 | 0.82 | 0.77 | 0.80 | 0.75 | 0.74 | 0.72 | 0.76 | 1.00 | 0.78 |
| 12 | 0.78 | 0.77 | 0.72 | 0.79 | 0.81 | 0.79 | 0.76 | 0.76 | 0.77 | 0.76 | 0.78 | 1.00 |
The table contains GDT_TS values (calculated on the Cα atoms) between the predicted models.
Read more about the global distance test (GDT, also written as GDT_TS to represent "total score") measure.
© Laboratory of Theory of Biopolymers, Faculty of Chemistry, University of Warsaw 2013