Status: Done started: 2018-May-19 17:14:36 UTC
| Project Name | Hewl |
| Sequence | KVFGRCELAA AMKRHGLDNY RGYSLGNWVC AAKFESNFNT QATNRNTDGS TDYGILQINS RWWCNDGRTP GSRNLCNIPC SALLSSDITA SVNCAKKIVS DGNGMNAWVA WRNRCKGTDV QAWIRGCRL |
| Secondary structure | CCCCHHHHHH HHHHCCCCCC CCCCHHHHHH HHHHHHCCCC CCEEECCCCC EEECCCCEEC CCCCCCCCCC CCCCCCCCCC CCCCCCCCHH HHHHHHHHHH CCCCCCCCHH HHHHCCCCCC CCCCCCCCC |
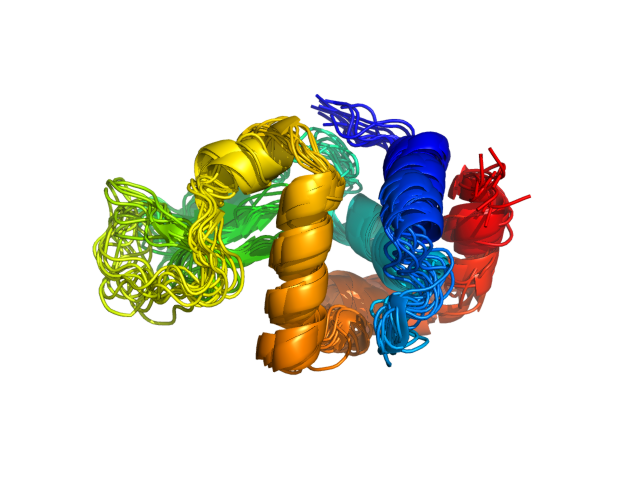
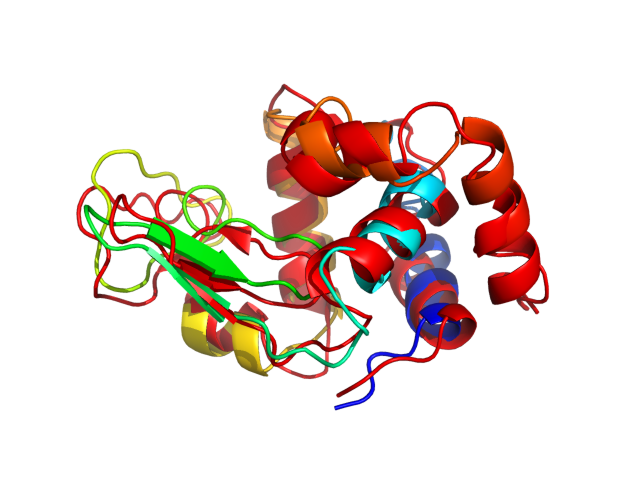
| Movie from predicted structures | To download the movie, right click on the desired file format:  
|
| Estimated finish time | 2018-May-19 21:50 UTC |
| Project Name | Hewl |
| Project Name | Hewl |
| Cluster # | 1 | 2 | 3 | 4 | 5 | 6 | 7 | 8 | 9 | 10 | 11 | 12 |
| Cluster density | 179.2 | 179.1 | 178.9 | 168.2 | 140.1 | 135.3 | 133.4 | 125.3 | 108.5 | 87.3 | 63.1 | 56.6 |
| Cluster size | 229 | 252 | 233 | 214 | 172 | 174 | 166 | 160 | 139 | 116 | 80 | 65 |
| Average cluster RMSD | 1.3 | 1.4 | 1.3 | 1.3 | 1.2 | 1.3 | 1.2 | 1.3 | 1.3 | 1.3 | 1.3 | 1.1 |
| # | 1 | 2 | 3 | 4 | 5 | 6 | 7 | 8 | 9 | 10 | 11 | 12 |
| RMSD | 2.89 | 2.02 | 2.67 | 2.49 | 2.18 | 2.35 | 2.36 | 2.46 | 2.75 | 2.40 | 2.42 | 2.47 |
| GDT_TS | 0.66 | 0.75 | 0.68 | 0.69 | 0.74 | 0.69 | 0.72 | 0.70 | 0.66 | 0.72 | 0.70 | 0.67 |
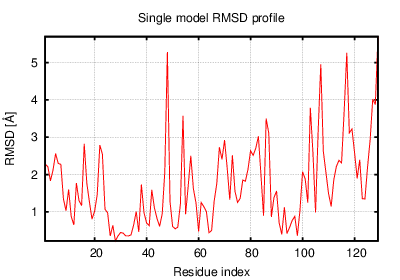
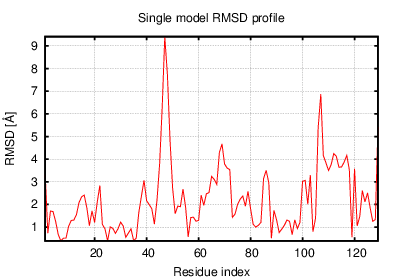
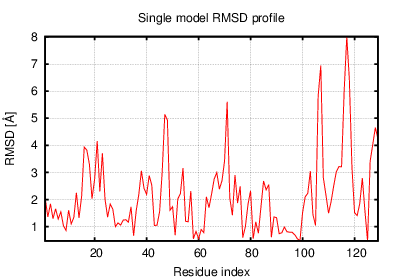
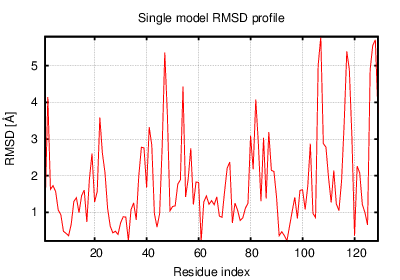
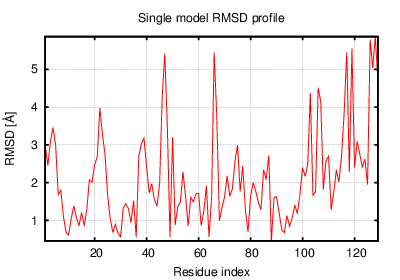
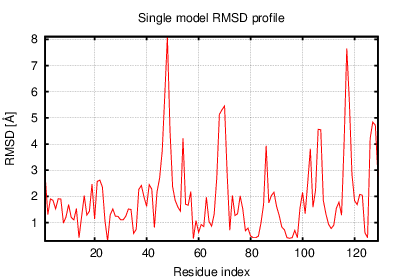
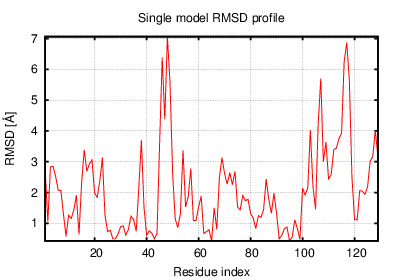
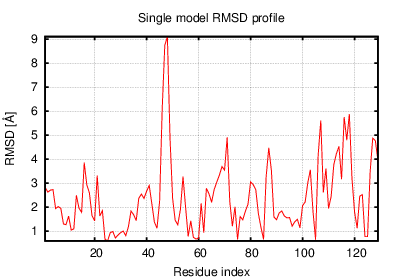
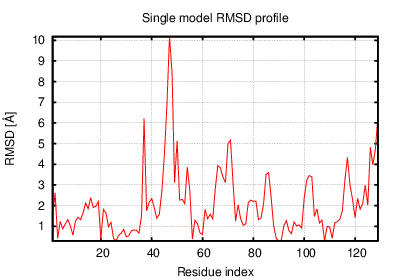
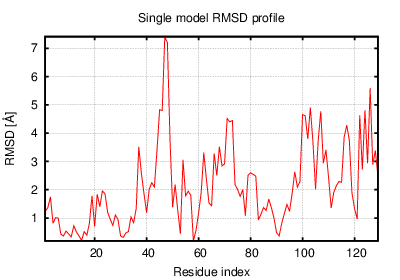
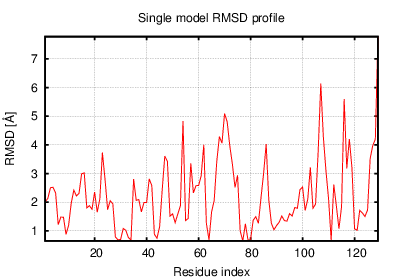
The table contains RMSD and GDT_TS values (calculated on the Cα atoms) between the predicted models and the input structure. Note that GDT_TS metric is intended as a more accurate measurement than the more common RMSD.
Read more about the root-mean-square deviation (RMSD) measure
Read more about the global distance test (GDT, also written as GDT_TS to represent "total score") measure.
| # | 1 | 2 | 3 | 4 | 5 | 6 | 7 | 8 | 9 | 10 | 11 | 12 |
| 1 | 0.00 | 2.58 | 1.98 | 2.08 | 2.59 | 3.20 | 2.32 | 2.26 | 2.08 | 2.05 | 2.47 | 3.25 |
| 2 | 2.58 | 0.00 | 2.36 | 2.17 | 1.94 | 2.25 | 1.86 | 1.78 | 2.36 | 2.41 | 2.12 | 2.24 |
| 3 | 1.98 | 2.36 | 0.00 | 2.17 | 2.41 | 2.74 | 2.19 | 2.01 | 2.01 | 2.06 | 2.25 | 2.90 |
| 4 | 2.08 | 2.17 | 2.17 | 0.00 | 1.98 | 2.53 | 2.00 | 1.84 | 1.98 | 2.28 | 2.29 | 2.82 |
| 5 | 2.59 | 1.94 | 2.41 | 1.98 | 0.00 | 1.96 | 1.95 | 2.11 | 2.57 | 2.41 | 2.09 | 2.10 |
| 6 | 3.20 | 2.25 | 2.74 | 2.53 | 1.96 | 0.00 | 2.36 | 2.29 | 3.02 | 2.60 | 2.56 | 2.07 |
| 7 | 2.32 | 1.86 | 2.19 | 2.00 | 1.95 | 2.36 | 0.00 | 1.66 | 2.24 | 2.26 | 2.09 | 2.30 |
| 8 | 2.26 | 1.78 | 2.01 | 1.84 | 2.11 | 2.29 | 1.66 | 0.00 | 2.09 | 2.38 | 2.07 | 2.38 |
| 9 | 2.08 | 2.36 | 2.01 | 1.98 | 2.57 | 3.02 | 2.24 | 2.09 | 0.00 | 2.41 | 2.35 | 2.92 |
| 10 | 2.05 | 2.41 | 2.06 | 2.28 | 2.41 | 2.60 | 2.26 | 2.38 | 2.41 | 0.00 | 2.32 | 2.90 |
| 11 | 2.47 | 2.12 | 2.25 | 2.29 | 2.09 | 2.56 | 2.09 | 2.07 | 2.35 | 2.32 | 0.00 | 2.71 |
| 12 | 3.25 | 2.24 | 2.90 | 2.82 | 2.10 | 2.07 | 2.30 | 2.38 | 2.92 | 2.90 | 2.71 | 0.00 |
The table contains RMSD values (calculated on the Cα atoms) between the predicted models.
Read more about the root-mean-square deviation (RMSD) measure.
| # | 1 | 2 | 3 | 4 | 5 | 6 | 7 | 8 | 9 | 10 | 11 | 12 |
| 1 | 1.00 | 0.68 | 0.73 | 0.73 | 0.65 | 0.60 | 0.70 | 0.70 | 0.73 | 0.76 | 0.69 | 0.61 |
| 2 | 0.68 | 1.00 | 0.72 | 0.72 | 0.74 | 0.70 | 0.76 | 0.79 | 0.73 | 0.69 | 0.73 | 0.69 |
| 3 | 0.73 | 0.72 | 1.00 | 0.74 | 0.68 | 0.66 | 0.74 | 0.75 | 0.74 | 0.76 | 0.70 | 0.66 |
| 4 | 0.73 | 0.72 | 0.74 | 1.00 | 0.74 | 0.67 | 0.78 | 0.78 | 0.79 | 0.72 | 0.71 | 0.68 |
| 5 | 0.65 | 0.74 | 0.68 | 0.74 | 1.00 | 0.75 | 0.75 | 0.72 | 0.66 | 0.67 | 0.73 | 0.74 |
| 6 | 0.60 | 0.70 | 0.66 | 0.67 | 0.75 | 1.00 | 0.69 | 0.69 | 0.61 | 0.66 | 0.66 | 0.75 |
| 7 | 0.70 | 0.76 | 0.74 | 0.78 | 0.75 | 0.69 | 1.00 | 0.79 | 0.74 | 0.71 | 0.75 | 0.71 |
| 8 | 0.70 | 0.79 | 0.75 | 0.78 | 0.72 | 0.69 | 0.79 | 1.00 | 0.76 | 0.70 | 0.74 | 0.70 |
| 9 | 0.73 | 0.73 | 0.74 | 0.79 | 0.66 | 0.61 | 0.74 | 0.76 | 1.00 | 0.72 | 0.70 | 0.65 |
| 10 | 0.76 | 0.69 | 0.76 | 0.72 | 0.67 | 0.66 | 0.71 | 0.70 | 0.72 | 1.00 | 0.70 | 0.62 |
| 11 | 0.69 | 0.73 | 0.70 | 0.71 | 0.73 | 0.66 | 0.75 | 0.74 | 0.70 | 0.70 | 1.00 | 0.65 |
| 12 | 0.61 | 0.69 | 0.66 | 0.68 | 0.74 | 0.75 | 0.71 | 0.70 | 0.65 | 0.62 | 0.65 | 1.00 |
The table contains GDT_TS values (calculated on the Cα atoms) between the predicted models.
Read more about the global distance test (GDT, also written as GDT_TS to represent "total score") measure.
© Laboratory of Theory of Biopolymers, Faculty of Chemistry, University of Warsaw 2013