Status: Done started: 2018-Nov-27 20:29:05 UTC
| Project Name | |
| Sequence | GRVRIEKMSS EVVDSNPYSR LMALKRMGIV SDYEKIRTFA VAIVGVGGVG SVTAEMLTRC GIGKLLLFDY DKVELANMNR LFFQPHQAGL SKVQAAEHTL RNINPDVLFE VHNYNITTVE NFQHFMDRIS NGGLEEGKPV DLVLSCVDNF EARMTINTAC NELGQTWMES GVSENAVSGH IQLIIPGESA CFACAPPLVV AANIDEKTLK REGVCAASLP TTMGVVAGIL VQNVLKFLLN FGTVSFYLGY NAMQDFFPTM SMKPNPQCDD RNCRKQQEEY KKKVAA |
| Secondary structure | CCCCCCCCCC CCCCCCCCHH HHCCCCCCCC CCCCCCCCCE EEEECCCHHH HHHHHHHHHH CCCEEEEECC CCCCCCCCCC CCCCCCCCCC CHHHHHHHHH HHHCCCCEEE EECCCCCCHH HHHHHHHHHH HCCCCCCCCC CEEEECCCCH HHHHHHHHHH HHHCCCEEEE EECCCCCEEE EEEECCCCCC CCCCCCCCCC CCCCCHHHHH HHCCCCCCCH HHHHHHHHHH HHHHHHHHHC CCCCCCEEEE ECCCCCCCCC CCCCCCCCCC HHHHHHHHHH HHHHHC |
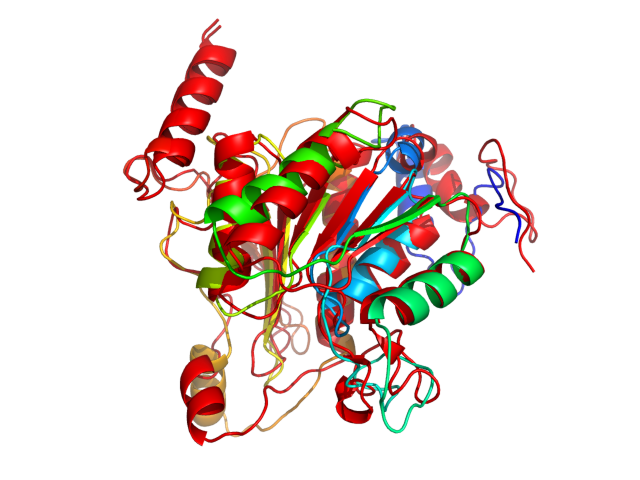
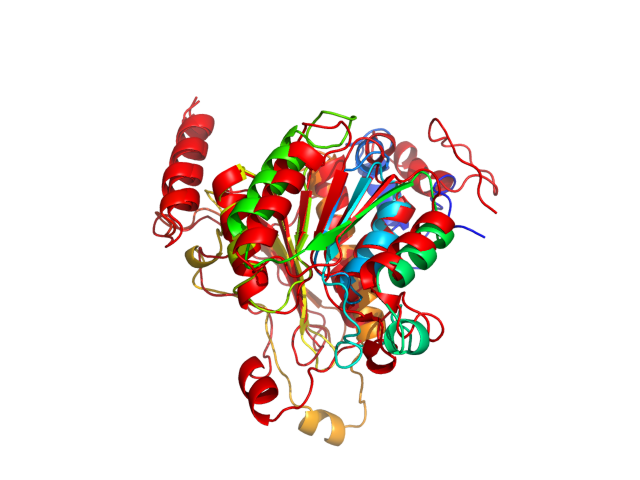
| Movie from predicted structures | To download the movie, right click on the desired file format:  
|
| Estimated finish time | 2018-Nov-28 00:25 UTC |
| Project Name |


| Project Name |
| Cluster # | 1 | 2 | 3 | 4 | 5 | 6 | 7 | 8 | 9 | 10 | 11 | 12 |
| Cluster density | 181.8 | 180.4 | 150.2 | 130.0 | 119.1 | 115.7 | 94.0 | 91.9 | 83.3 | 70.1 | 61.9 | 40.8 |
| Cluster size | 303 | 263 | 239 | 193 | 190 | 181 | 124 | 137 | 115 | 102 | 92 | 61 |
| Average cluster RMSD | 1.7 | 1.5 | 1.6 | 1.5 | 1.6 | 1.6 | 1.3 | 1.5 | 1.4 | 1.5 | 1.5 | 1.5 |
| # | 1 | 2 | 3 | 4 | 5 | 6 | 7 | 8 | 9 | 10 | 11 | 12 |
| RMSD | 5.88 | 4.95 | 6.15 | 5.37 | 5.99 | 5.74 | 5.22 | 6.01 | 4.58 | 4.32 | 5.36 | 4.12 |
| GDT_TS | 0.60 | 0.62 | 0.60 | 0.63 | 0.59 | 0.60 | 0.61 | 0.60 | 0.61 | 0.63 | 0.62 | 0.66 |
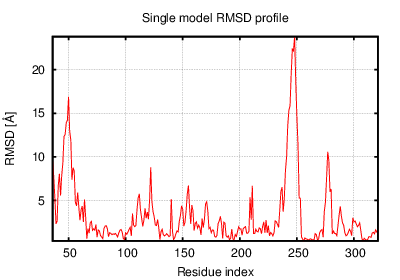
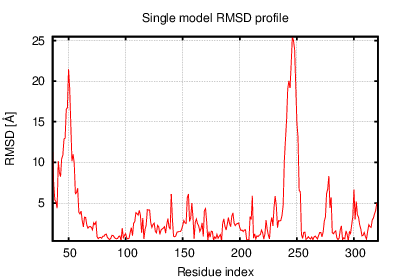
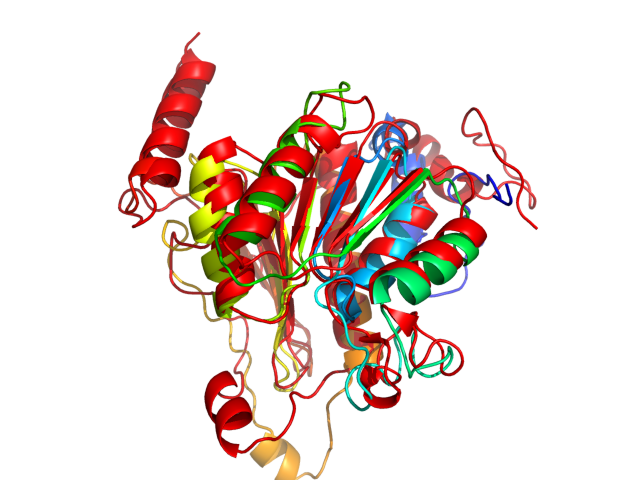
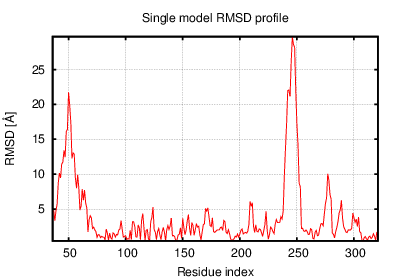
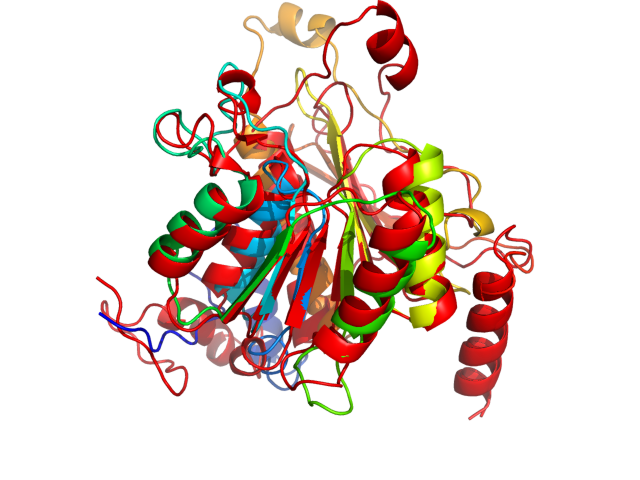
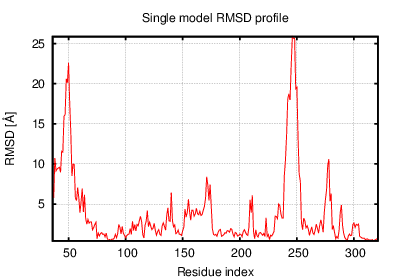
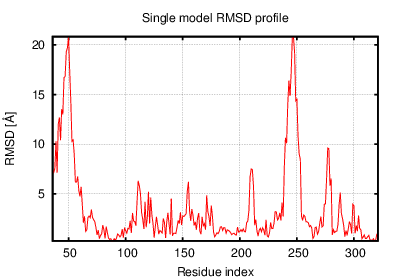
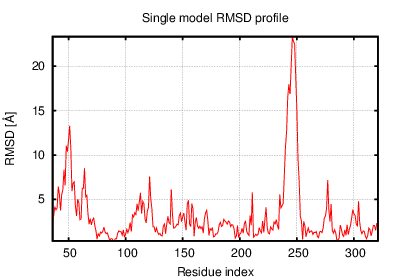
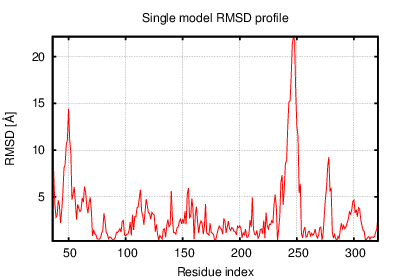
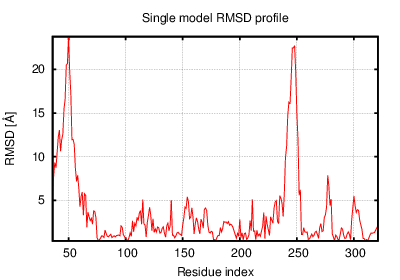
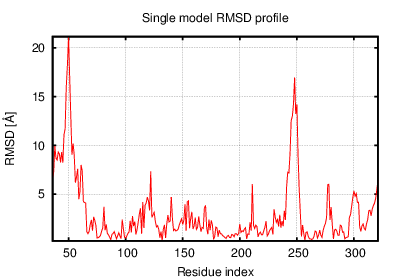
The table contains RMSD and GDT_TS values (calculated on the Cα atoms) between the predicted models and the input structure. Note that GDT_TS metric is intended as a more accurate measurement than the more common RMSD.
Read more about the root-mean-square deviation (RMSD) measure
Read more about the global distance test (GDT, also written as GDT_TS to represent "total score") measure.
| # | 1 | 2 | 3 | 4 | 5 | 6 | 7 | 8 | 9 | 10 | 11 | 12 |
| 1 | 0.00 | 3.38 | 2.09 | 3.01 | 2.36 | 1.88 | 3.38 | 3.07 | 3.10 | 3.63 | 3.16 | 3.89 |
| 2 | 3.38 | 0.00 | 3.52 | 2.88 | 3.15 | 3.14 | 2.74 | 2.99 | 2.61 | 2.43 | 3.03 | 3.32 |
| 3 | 2.09 | 3.52 | 0.00 | 2.92 | 2.59 | 2.06 | 3.35 | 3.21 | 3.23 | 3.79 | 3.08 | 3.90 |
| 4 | 3.01 | 2.88 | 2.92 | 0.00 | 2.72 | 2.97 | 3.08 | 3.17 | 2.80 | 3.12 | 2.57 | 3.08 |
| 5 | 2.36 | 3.15 | 2.59 | 2.72 | 0.00 | 2.56 | 3.48 | 3.18 | 3.27 | 3.63 | 3.04 | 4.06 |
| 6 | 1.88 | 3.14 | 2.06 | 2.97 | 2.56 | 0.00 | 2.98 | 3.19 | 3.14 | 3.45 | 2.96 | 3.70 |
| 7 | 3.38 | 2.74 | 3.35 | 3.08 | 3.48 | 2.98 | 0.00 | 3.39 | 3.42 | 3.44 | 2.66 | 3.25 |
| 8 | 3.07 | 2.99 | 3.21 | 3.17 | 3.18 | 3.19 | 3.39 | 0.00 | 3.29 | 3.20 | 3.41 | 4.11 |
| 9 | 3.10 | 2.61 | 3.23 | 2.80 | 3.27 | 3.14 | 3.42 | 3.29 | 0.00 | 2.20 | 2.95 | 3.03 |
| 10 | 3.63 | 2.43 | 3.79 | 3.12 | 3.63 | 3.45 | 3.44 | 3.20 | 2.20 | 0.00 | 3.15 | 3.16 |
| 11 | 3.16 | 3.03 | 3.08 | 2.57 | 3.04 | 2.96 | 2.66 | 3.41 | 2.95 | 3.15 | 0.00 | 2.85 |
| 12 | 3.89 | 3.32 | 3.90 | 3.08 | 4.06 | 3.70 | 3.25 | 4.11 | 3.03 | 3.16 | 2.85 | 0.00 |
The table contains RMSD values (calculated on the Cα atoms) between the predicted models.
Read more about the root-mean-square deviation (RMSD) measure.
| # | 1 | 2 | 3 | 4 | 5 | 6 | 7 | 8 | 9 | 10 | 11 | 12 |
| 1 | 1.00 | 0.65 | 0.76 | 0.69 | 0.73 | 0.77 | 0.66 | 0.67 | 0.64 | 0.63 | 0.65 | 0.62 |
| 2 | 0.65 | 1.00 | 0.67 | 0.68 | 0.69 | 0.68 | 0.72 | 0.67 | 0.67 | 0.72 | 0.67 | 0.64 |
| 3 | 0.76 | 0.67 | 1.00 | 0.69 | 0.69 | 0.74 | 0.67 | 0.67 | 0.64 | 0.65 | 0.66 | 0.63 |
| 4 | 0.69 | 0.68 | 0.69 | 1.00 | 0.65 | 0.68 | 0.67 | 0.65 | 0.71 | 0.69 | 0.73 | 0.74 |
| 5 | 0.73 | 0.69 | 0.69 | 0.65 | 1.00 | 0.71 | 0.67 | 0.66 | 0.65 | 0.65 | 0.64 | 0.59 |
| 6 | 0.77 | 0.68 | 0.74 | 0.68 | 0.71 | 1.00 | 0.66 | 0.66 | 0.64 | 0.63 | 0.67 | 0.62 |
| 7 | 0.66 | 0.72 | 0.67 | 0.67 | 0.67 | 0.66 | 1.00 | 0.67 | 0.65 | 0.64 | 0.65 | 0.66 |
| 8 | 0.67 | 0.67 | 0.67 | 0.65 | 0.66 | 0.66 | 0.67 | 1.00 | 0.63 | 0.65 | 0.62 | 0.62 |
| 9 | 0.64 | 0.67 | 0.64 | 0.71 | 0.65 | 0.64 | 0.65 | 0.63 | 1.00 | 0.74 | 0.70 | 0.67 |
| 10 | 0.63 | 0.72 | 0.65 | 0.69 | 0.65 | 0.63 | 0.64 | 0.65 | 0.74 | 1.00 | 0.71 | 0.67 |
| 11 | 0.65 | 0.67 | 0.66 | 0.73 | 0.64 | 0.67 | 0.65 | 0.62 | 0.70 | 0.71 | 1.00 | 0.69 |
| 12 | 0.62 | 0.64 | 0.63 | 0.74 | 0.59 | 0.62 | 0.66 | 0.62 | 0.67 | 0.67 | 0.69 | 1.00 |
The table contains GDT_TS values (calculated on the Cα atoms) between the predicted models.
Read more about the global distance test (GDT, also written as GDT_TS to represent "total score") measure.
© Laboratory of Theory of Biopolymers, Faculty of Chemistry, University of Warsaw 2013