| Chain sequence(s) |
X: EVTIKVNLIFADGKIQTAEFKGTFEEATAEAYRYADLLAKVNGEYTADLEDGGNHMNIKFA |
| Distance of aggregation | 10 Å |
| Dynamic mode | Yes |
| Mutated residues | AX848R, FX843Y |
| Energy difference between WT (input) and mutated protein (by FoldX) | -0.59263 kcal/mol
Changes in protein stability upon mutation are calculated using the FoldX forcefield. Computational prediction of protein stability is used with the intention of preventing the experimental characterization of proteins bearing mutations that significantly destabilize their structure. Mutations resulting in a predicted reduction in protein stability ≥ 1 kcal/mol are considered disruptive. |
The table below lists A3D score for protein residues. Residues with A3D score > 0.0000 are marked by yellow rows.
| residue index | residue name | chain | Aggrescan3D score | mutation |
|---|---|---|---|---|
| residue index | residue name | chain | Aggrescan3D score | |
| 820 | E | X | -1.7119 | |
| 821 | V | X | -0.7478 | |
| 822 | T | X | -1.2043 | |
| 823 | I | X | 0.0000 | |
| 824 | K | X | -2.4167 | |
| 825 | V | X | 0.0000 | |
| 826 | N | X | -1.0771 | |
| 827 | L | X | 0.0000 | |
| 828 | I | X | 1.1241 | |
| 829 | F | X | 0.0000 | |
| 830 | A | X | -0.6775 | |
| 831 | D | X | -1.9821 | |
| 832 | G | X | -1.3027 | |
| 833 | K | X | -1.2483 | |
| 834 | I | X | 0.7555 | |
| 835 | Q | X | 0.2094 | |
| 836 | T | X | -0.4106 | |
| 837 | A | X | -1.4910 | |
| 838 | E | X | -2.3383 | |
| 839 | F | X | 0.0000 | |
| 840 | K | X | -2.4391 | |
| 841 | G | X | -1.7157 | |
| 842 | T | X | -1.2887 | |
| 843 | Y | X | -0.7144 | mutated: FX843Y |
| 844 | E | X | -1.9881 | |
| 845 | E | X | -2.1605 | |
| 846 | A | X | 0.0000 | |
| 847 | T | X | -1.2528 | |
| 848 | R | X | -1.7026 | mutated: AX848R |
| 849 | E | X | -1.4416 | |
| 850 | A | X | 0.0000 | |
| 851 | Y | X | 0.0973 | |
| 852 | R | X | -0.8989 | |
| 853 | Y | X | -0.1913 | |
| 854 | A | X | 0.1729 | |
| 855 | D | X | -0.5960 | |
| 856 | L | X | 0.2780 | |
| 857 | L | X | 0.0000 | |
| 858 | A | X | -0.9450 | |
| 859 | K | X | -1.1079 | |
| 860 | V | X | 0.2422 | |
| 861 | N | X | -1.4575 | |
| 862 | G | X | -0.8806 | |
| 863 | E | X | -0.9637 | |
| 864 | Y | X | 0.6616 | |
| 865 | T | X | 0.3290 | |
| 866 | A | X | -0.2129 | |
| 867 | D | X | -0.8889 | |
| 868 | L | X | -0.4867 | |
| 869 | E | X | -2.5953 | |
| 870 | D | X | -2.9418 | |
| 871 | G | X | -2.1877 | |
| 872 | G | X | -1.8864 | |
| 873 | N | X | -1.8546 | |
| 874 | H | X | -2.2056 | |
| 875 | M | X | -1.3034 | |
| 876 | N | X | -0.7511 | |
| 877 | I | X | 0.0000 | |
| 878 | K | X | 0.5011 | |
| 879 | F | X | 1.2175 |
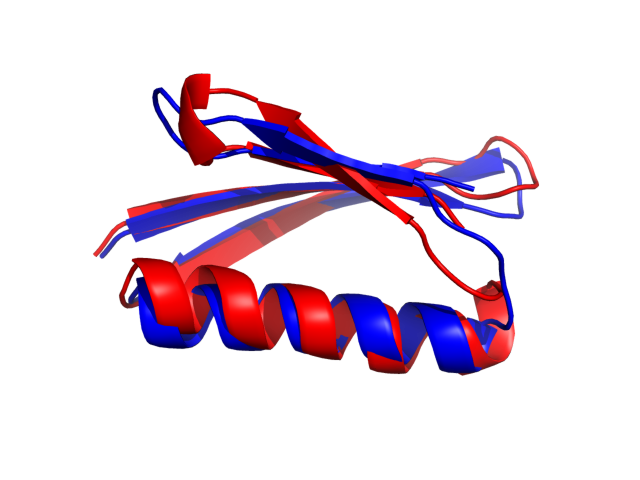
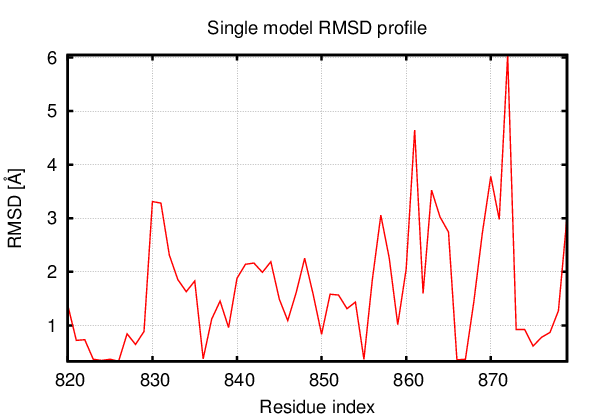
Above is the comparison between the input structure and the most aggregation prone model (predicted in the flexibility simulations, download both models in the PDB file format , download table with rmsd values ). The picture presents the most aggregation prone model (in blue) superimposed on the input structure (in red). The plot shows rmsd profile (distances between residues of the superimposed structures).
Dynamic mode uses CABS-flex simulations of protein structure fluctuations. The structure fluctuations may have impact on the size and extent of aggregation "hot-spots" on the protein surface. The dynamic mode uses the following pipeline: (1) based on the input structure, CABS-flex predicts a set of different models reflecting protein dynamics in solution; (2) for each of these models A3D score is calculated; (3) finally, the most aggregation prone model (the model with the highest A3D score, -0.8346 in this case) is selected and presented in A3D results.
 ALA alanine
 ARG arginine
 ASN asparagine
 ASP aspartic acid
 CYS cysteine
 GLN glutamine
 GLU glutamic acid
 GLY glycine
 HIS histidine
 ILE isoleucine
 LEU leucine
 LYS lysine
 MET methionine
 PHE phenylalanine
 PRO proline
 SER serine
 THR threonine
 TRP tryptophan
 TYR tyrosine
 VAL valine