Project name: 468718088117aa1 [mutate: GS35A, AS49A, AS75A, KR87A]
Status: done
Started: 2026-03-06 09:35:52
| Chain sequence(s) |
A: EVQLVESGGGLVQAGGSLRLSCAASGRTFSSYAMGWFRQAPGKEREFVAAISRSAGTTRYADSVKGRFTISRDNAKNMLYLQMHSLKPEDTAVYYCAAATLQSTVVLSTHNYDYWGQGTQVTVSS
input PDB |
| Selected Chain(s) | A |
| Distance of aggregation | 5 Å |
| FoldX usage | Yes |
| pH calculations | No |
| alphaCutter usage | No |
| Dynamic mode | Yes |
| Automated mutations | No |
| Mutated residues | AS75A,KR87A,GS35A,AS49A |
| Energy difference between WT (input) and mutated protein (by FoldX) | 1.63419 kcal/mol
CAUTION: Your mutation/s can destabilize the protein structure |
| Downloads | Download all the data |
| Simulation log |
[INFO]       Logger:   Verbosity set to: 2 - [INFO]                                                (00:00:02)
[WARNING]    runJob:   Working directory already exists (possibly overwriting previous results -ow
                       to prevent this behavior)                                                   (00:00:02)
[INFO]       runJob:   Starting aggrescan3d job on: input.pdb with A chain(s) selected             (00:00:02)
[INFO]       runJob:   Creating pdb object from: input.pdb                                         (00:00:02)
[INFO]       FoldX:    Starting FoldX energy minimization                                          (00:00:02)
[INFO]       FoldX:    Building mutant model                                                       (00:02:42)
[INFO]       CABS:     Running CABS flex simulation                                                (00:05:28)
[INFO]       Analysis: Starting Aggrescan4D on model_8.pdb                                         (00:28:23)
[INFO]       Analysis: Starting Aggrescan4D on model_6.pdb                                         (00:28:23)
[INFO]       Analysis: Starting Aggrescan4D on model_11.pdb                                        (00:28:24)
[INFO]       Analysis: Starting Aggrescan4D on model_7.pdb                                         (00:28:25)
[INFO]       Analysis: Starting Aggrescan4D on model_3.pdb                                         (00:28:25)
[INFO]       Analysis: Starting Aggrescan4D on model_5.pdb                                         (00:28:26)
[INFO]       Analysis: Starting Aggrescan4D on model_1.pdb                                         (00:28:27)
[INFO]       Analysis: Starting Aggrescan4D on model_0.pdb                                         (00:28:28)
[INFO]       Analysis: Starting Aggrescan4D on model_2.pdb                                         (00:28:28)
[INFO]       Analysis: Starting Aggrescan4D on model_4.pdb                                         (00:28:29)
[INFO]       Analysis: Starting Aggrescan4D on model_10.pdb                                        (00:28:29)
[INFO]       Analysis: Starting Aggrescan4D on model_9.pdb                                         (00:28:30)
[INFO]       Analysis: Starting Aggrescan4D on input.pdb                                           (00:28:31)
[INFO]       Analysis: Starting Aggrescan4D on folded.pdb                                          (00:28:35)
[INFO]       Main:     Simulation completed successfully.                                          (00:28:36)
|
- Minimal score value
- -2.2286
- Maximal score value
- 1.5767
- Average score
- -0.2384
- Total score value
- -29.7971
The table below lists A4D score for protein residues. Residues with A4D score > 0.0000 are marked by yellow rows.
| residue index | residue name | chain | Aggrescan4D score | mutation |
|---|---|---|---|---|
| 1 | E | A | -1.8199 | |
| 2 | V | A | 0.0000 | |
| 3 | Q | A | -1.1983 | |
| 4 | L | A | 0.0000 | |
| 5 | V | A | 1.3684 | |
| 6 | E | A | 0.0586 | |
| 7 | S | A | -0.2685 | |
| 8 | G | A | -0.5841 | |
| 9 | G | A | -0.5562 | |
| 10 | G | A | 0.0000 | |
| 11 | L | A | 0.9196 | |
| 12 | V | A | 0.0000 | |
| 13 | Q | A | -1.2001 | |
| 14 | A | A | -0.3005 | |
| 15 | G | A | -0.5520 | |
| 16 | G | A | -0.5940 | |
| 17 | S | A | -0.2890 | |
| 18 | L | A | 0.0000 | |
| 19 | R | A | -1.8999 | |
| 20 | L | A | 0.0000 | |
| 21 | S | A | -0.0309 | |
| 22 | C | A | 0.0000 | |
| 23 | A | A | 0.0200 | |
| 24 | A | A | -0.0041 | |
| 25 | S | A | -0.1631 | |
| 26 | G | A | -0.5913 | |
| 27 | R | A | -0.6826 | |
| 28 | T | A | -0.1829 | |
| 29 | F | A | 0.0000 | |
| 30 | S | A | -0.2129 | |
| 31 | S | A | 0.0000 | |
| 32 | Y | A | 0.0000 | |
| 33 | A | A | 0.0000 | |
| 34 | M | A | 0.0000 | |
| 35 | S | A | 0.0000 | mutated: GS35A |
| 36 | W | A | 0.0000 | |
| 37 | F | A | 0.0000 | |
| 38 | R | A | 0.0000 | |
| 39 | Q | A | -0.5866 | |
| 40 | A | A | 0.0000 | |
| 41 | P | A | -0.3738 | |
| 42 | G | A | -0.5743 | |
| 43 | K | A | -0.7667 | |
| 44 | E | A | -2.2232 | |
| 45 | R | A | -2.2286 | |
| 46 | E | A | 0.0000 | |
| 47 | F | A | 1.3479 | |
| 48 | V | A | 0.0000 | |
| 49 | S | A | 0.0000 | mutated: AS49A |
| 50 | A | A | 0.0000 | |
| 51 | I | A | 0.0000 | |
| 52 | S | A | 0.0000 | |
| 53 | R | A | -0.5521 | |
| 54 | S | A | -0.2982 | |
| 55 | A | A | -0.0716 | |
| 56 | G | A | -0.4591 | |
| 57 | T | A | -0.1142 | |
| 58 | T | A | -0.3145 | |
| 59 | R | A | -1.2112 | |
| 60 | Y | A | 1.0284 | |
| 61 | A | A | 0.2254 | |
| 62 | D | A | -0.4493 | |
| 63 | S | A | -0.2541 | |
| 64 | V | A | -0.1505 | |
| 65 | K | A | -1.6790 | |
| 66 | G | A | -0.7775 | |
| 67 | R | A | -1.8625 | |
| 68 | F | A | 0.0000 | |
| 69 | T | A | -0.0183 | |
| 70 | I | A | 0.0000 | |
| 71 | S | A | -0.1645 | |
| 72 | R | A | -0.7657 | |
| 73 | D | A | -1.1875 | |
| 74 | N | A | -1.4846 | |
| 75 | S | A | -0.7742 | mutated: AS75A |
| 76 | K | A | -1.7406 | |
| 77 | N | A | 0.0000 | |
| 78 | M | A | 0.6986 | |
| 79 | L | A | 0.0000 | |
| 80 | Y | A | 0.3447 | |
| 81 | L | A | 0.0000 | |
| 82 | Q | A | -0.7420 | |
| 83 | M | A | 0.0000 | |
| 84 | H | A | -0.7192 | |
| 85 | S | A | -0.3119 | |
| 86 | L | A | 0.0000 | |
| 87 | R | A | -0.4717 | mutated: KR87A |
| 88 | P | A | -0.3039 | |
| 89 | E | A | 0.0000 | |
| 90 | D | A | -1.7935 | |
| 91 | T | A | -0.3544 | |
| 92 | A | A | 0.0000 | |
| 93 | V | A | 0.1097 | |
| 94 | Y | A | 0.0000 | |
| 95 | Y | A | 0.0000 | |
| 96 | C | A | 0.0000 | |
| 97 | A | A | 0.0000 | |
| 98 | A | A | 0.0000 | |
| 99 | A | A | 0.0000 | |
| 100 | T | A | 0.2723 | |
| 101 | L | A | 1.3761 | |
| 102 | Q | A | -0.5688 | |
| 103 | S | A | -0.2534 | |
| 104 | T | A | 0.2242 | |
| 105 | V | A | 1.5767 | |
| 106 | V | A | 0.0000 | |
| 107 | L | A | 0.9734 | |
| 108 | S | A | 0.0000 | |
| 109 | T | A | -0.2234 | |
| 110 | H | A | -0.9580 | |
| 111 | N | A | -0.6875 | |
| 112 | Y | A | 1.0460 | |
| 113 | D | A | -0.6083 | |
| 114 | Y | A | 0.0000 | |
| 115 | W | A | 1.1665 | |
| 116 | G | A | 0.0318 | |
| 117 | Q | A | -0.5128 | |
| 118 | G | A | -0.4008 | |
| 119 | T | A | 0.0000 | |
| 120 | Q | A | -1.1611 | |
| 121 | V | A | 0.0000 | |
| 122 | T | A | 0.0982 | |
| 123 | V | A | 0.0000 | |
| 124 | S | A | -0.1638 | |
| 125 | S | A | -0.2364 |
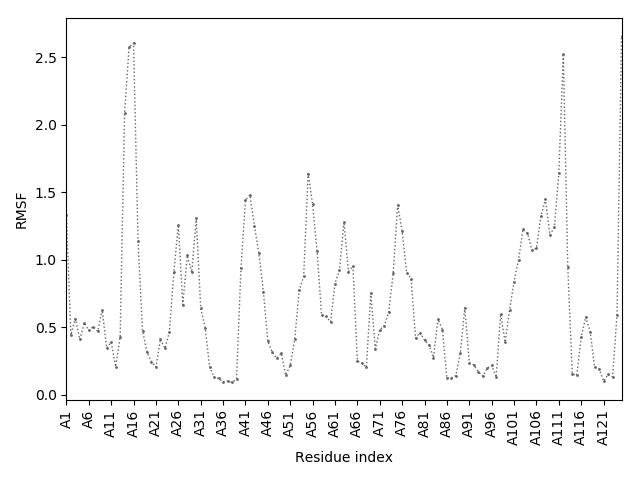
CABS-flex predictions of flexibility of input structure
In dynamic mode, A4D analysis is performed on the set of models reflecting fluctuations of the input structure (predicted
by CABS-flex method, models are numbered from 0 to 11) and the input model.
Their A4D scores are provided below in the table.
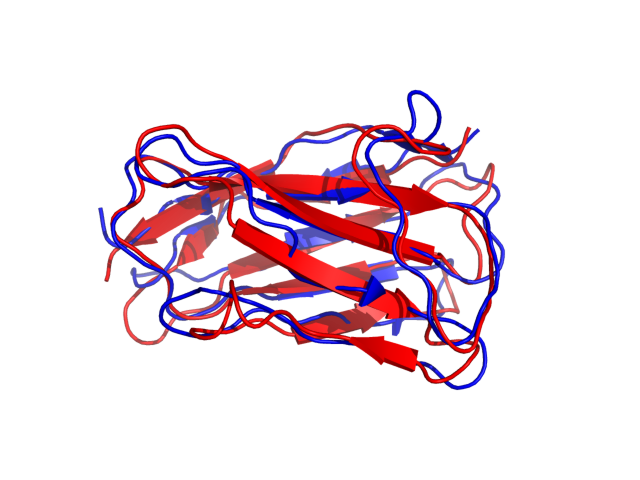
The right panel presents comparison of the most aggregation prone model (with the highest A4D score, -0.2384 in this case) with the input model
(the most aggregation prone model in blue, input in red) and RMSF plot which shows the extent of residue fluctuations in Angstroms (predicted by CABS-flex).
Model |
Average A4D Score |
|||
| model_1 | -0.2384 | View | CSV | PDB |
| model_10 | -0.2532 | View | CSV | PDB |
| model_4 | -0.2542 | View | CSV | PDB |
| model_7 | -0.2549 | View | CSV | PDB |
| model_8 | -0.2583 | View | CSV | PDB |
| model_11 | -0.2686 | View | CSV | PDB |
| CABS_average | -0.2694 | View | CSV | PDB |
| model_6 | -0.271 | View | CSV | PDB |
| model_0 | -0.2722 | View | CSV | PDB |
| model_2 | -0.2817 | View | CSV | PDB |
| input | -0.2864 | View | CSV | PDB |
| model_5 | -0.2867 | View | CSV | PDB |
| model_9 | -0.2917 | View | CSV | PDB |
| model_3 | -0.3022 | View | CSV | PDB |
 ALA alanine
 ARG arginine
 ASN asparagine
 ASP aspartic acid
 CYS cysteine
 GLN glutamine
 GLU glutamic acid
 GLY glycine
 HIS histidine
 ILE isoleucine
 LEU leucine
 LYS lysine
 MET methionine
 PHE phenylalanine
 PRO proline
 SER serine
 THR threonine
 TRP tryptophan
 TYR tyrosine
 VAL valine