Aggrescan4D
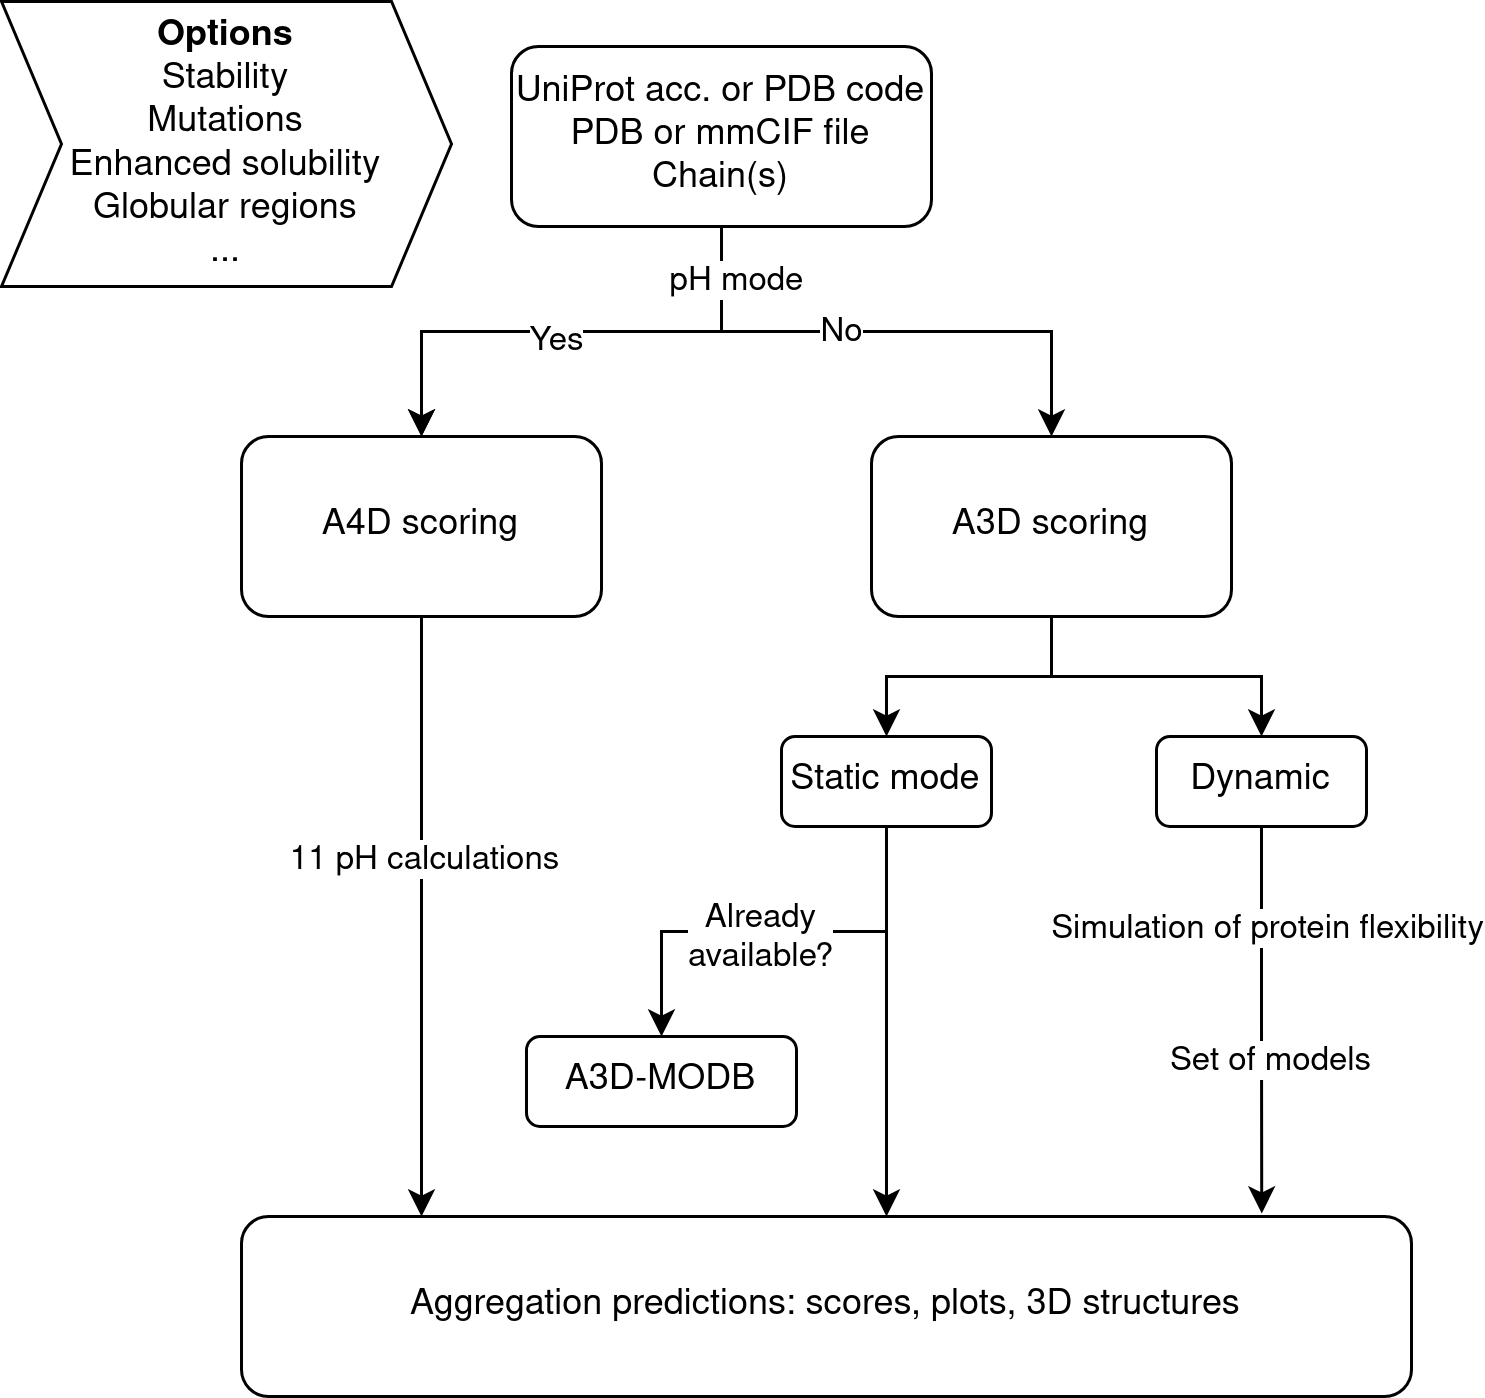
Aggrescan4D (A4D) is aimed to predict the aggregation propensities of proteins in their folded states at different pH values. Towards this aim A4D uses as input protein 3D-structures derived from X-ray diffraction, solution NMR or modelling approaches in PDB/mmCIF format. The structures are energetically minimized before their analysis. The method exploits an structurally corrected pH-dependent lipophilicity scale of amino acids [1] and incorporates pKa-ANI for the prediction of structural pKa values [2] and projects this scale in the protein 3D structure. In the A4D method the intrinsic aggregation propensity of each particular amino acid in the structure is modulated by its specific structural context. Aggregation propensity is calculated for spherical regions centered on every residue Cα carbon. A4D discards the negligible contribution of highly hydrophobic residues hidden in the core of folded proteins to aggregation and focuses the prediction on protein surfaces. This structure-based approach identifies aggregation patches that are typically not contiguous in sequence like those identified by linear sequence or composition-based algorithms, outperforming them.
By including pH, users are now able to compare the structural aggregation propensity of the same protein under 11 different pH conditions (from pH 4.0 to pH 9.0, step size 0.5), effectively obtaining a difference in protein solubility without the need to mutate residues. This provides a unique structurally corrected pH-aware aggregation value (A4D score) for each amino acid in the structure, which is formulated as:
\( A4D\ score = Agg_i × \left(α× e^{\beta × RSA_i} \right)+ \sum \left[Agg_e× \left(α× e^{\beta×RSA_e}\right) × \left(\gamma× e^{-\delta ×dist}\right) \right] \)
If the pH mode is unselected, the original A3D scoring method is run [3] (it is also run with pH predictions only as a standard model for comparison purposes).
Most structural aggregation predictions in standard conditions (non-pH, static mode) are already available at the A3D-MODB, which collects AF-proteome predictions for 12 model organisms [4] For this reason, if UniProt accessions numbers are provided, now A4D redirects to A3D-MODB precalculated jobs, thus avoiding unnecessary calculations.
If desired, the identified aggregation prone residues or their surroundings are still subjected to be virtually mutated to design variants with increased solubility. The selected mutation/mutations are modeled and a new A4D prediction is subsequently generated on top of this new structure. The Enhance protein solubility with charged mutations mode automatically identifies the strongest APRs (aggregation prone regions) in the structure and suggests a series of point mutations to charged residues that would increase the protein solubility without impacting its stability. The new Improve protein solubility with evolutionary conserved mutations mode suggests point mutations to solubilizing residues that are evolutionarily conserved (based on a PAM250 matrix) thus promoting more stable prediction variants. Please note that these modes are not compatible with pH calculations.
The dynamic structural fluctuations that a protein experiments in solution influence its aggregation propensity, promoting partial exposure of usually buried residues. In this way, mutations leading to destabilized protein variants with increased conformational fluctuations usually have a huge impact on the aggregation propensity of the protein. For this reason A4D can also be run in Dynamic mode (not compatible with pH mode). In this mode, A4D exploits the CABS-flex approach [5] for the fast simulations of near-native dynamics of globular proteins. The aggregation properties of the ensemble of protein models are analysed and the most aggregation-prone conformer is selected as a proxy of the aggregation promoting state in the particular protein of interest.
Since many proteins contain such flexible segments in the form of intrinsically disordered/low complexity regions, A4D also includes the Analysis of the globular regions mode to automatically identify and cut disordered sequences that could blur a confident structural prediction by means of the AlphaCutter algorithm [6]
Overall, A4D jumps to a new dimension by considering the pH variable in its pipeline as well as many new functional features. This should be the first step towards incorporating other environmental variables that are known to influence protein aggregation.
FAQs:
What’s new in A4D in comparison with previous A3D?
A4D includes plenty of novel features in comparison with the previous A3D 2.0:
Inclusion of pH into structural aggregation predictions.
Additional input options which include mmCIF files and UniProt Accession numbers.
Direct parsing with A3D-MODB for standard jobs available in the database.
Improve protein solubility with evolutionary conserved mutations.
Removal of disordered regions with AlphaCutter.
Faster calculations through backend optimization in the Python code.
Improved frontend visualization with an updated content style.
Which A4D output should I consider when I analyze different pH-dependent structures?
Data shows that, for globular proteins, maximum A4D scores better correlate predictions with experiments. Instead, for IDPs, it is the average score. We rationalize that maximum scores account for highly structural aggregation prone regions in the surface of globular proteins whereas the average scores consider aggregation propensity distributed along exposed disordered sequences. Therefore, for globular proteins we recommend A4D maximum score and for IDPs A4D average score.
What happens if I provide a UniProt Accession number?
If you provide a UniProt accession number as input, the A4D will look for the predicted PDB structure in the AlphaFold database and run the job with it. If default options are selected without the pH mode enabled, A4D will try to recover precalculated jobs that are already available at the A3D-MODB and display the results.
Can I run a protein that is not fully structured?
A4D allows for the calculation of PDBs that may contain disordered segments. However, users can select the option of removing disordered residues with AlphaCutter. This will render a prediction of only the globular moiety of the protein. If the pH mode is selected, a suggestion of the metric that should be used is provided in the pH details tab. This metric is based on an underlying quantitative measure that captures the compactness of the protein structure.
Can I still apply mutations on my protein?
Yes, A4D still allows for the evaluation of mutations in the aggregation propensity of protein structures. Besides the charged mutations mode to enhance protein solubility, A4D offers a new module that automatically identifies the most aggregation prone regions and mutates them to solubilizing evolutionary conserved residues that should maintain protein stability.
How does the enhanced/improved protein solubility mode work?
This method automatically selects the most aggregation prone residues and mutates them to charged or evolutionary conserved residues, depending on the selected mode. The resulting mutations consider both the solubilizing and energetic effect of the variants thus providing a unified criteria for the best mutant candidates. Charged mutations often result in enhanced solubilities but may come at the cost of less favorable energetic effects. Evolutionary mutations slightly improve solubility but may have higher stabilizing effects.
References:
-
Aggrescan3D (A3D) 2.0: prediction and engineering of protein solubility, Nucleic Acids Research, gkz321, 2019
-
A3D Model Organism Database (A3D-MODB): a database for proteome aggregation predictions in model organisms, Nucleic Acids Research, gkad942, 2023
-
Aggrescan3D standalone package for structure-based prediction of protein aggregation properties Bioinformatics, btz143, 2019
-
AGGRESCAN3D (A3D): server for prediction of aggregation properties of protein structures, Nucleic Acids Research, 43, W306-W313, 2015
-
Combining Structural Aggregation Propensity and Stability Predictions To Redesign Protein Solubility, Molecular Pharmaceutics, 10.1021/acs.molpharmaceut.8b00341, 2018
-
The example guide for A3D 2.0: A3D 2.0 update for the prediction and optimization of protein solubility, Methods in Molecular Biology (biorxiv preprint), 2021
Aggrescan4D employs the following tools
Aggrescan3D standalone (aggregation propensity calculations based on 3D structures)
pKa-ANI (structural pKa calculations)
AlphaCutter (determination of compact, globular domains)
A3D-MODB (obtention of pre-calculated jobs)
AlphaFold Database (uniprot-pdb parsing)
FreeSASA (accessible surface calculations)
FoldX (modeling of mutations in protein structures)
Dynamic mode: CABS-flex (simulations of protein structure fluctuations and accompanying analysis)
3Dmol (interactive protein visualization)
Pymol (protein visualization)