Tutorial
Submitting a job
RequirementsA PDB/mmCIF file or PDB/UniProt accession code is all that's required to run a A4D job.
We strongly recommend against using Internet Explorer with the A4D server as it lacks certain features required for the server functionality.
Submit page
The Main page contains the panels that allow for the job to be submitted.
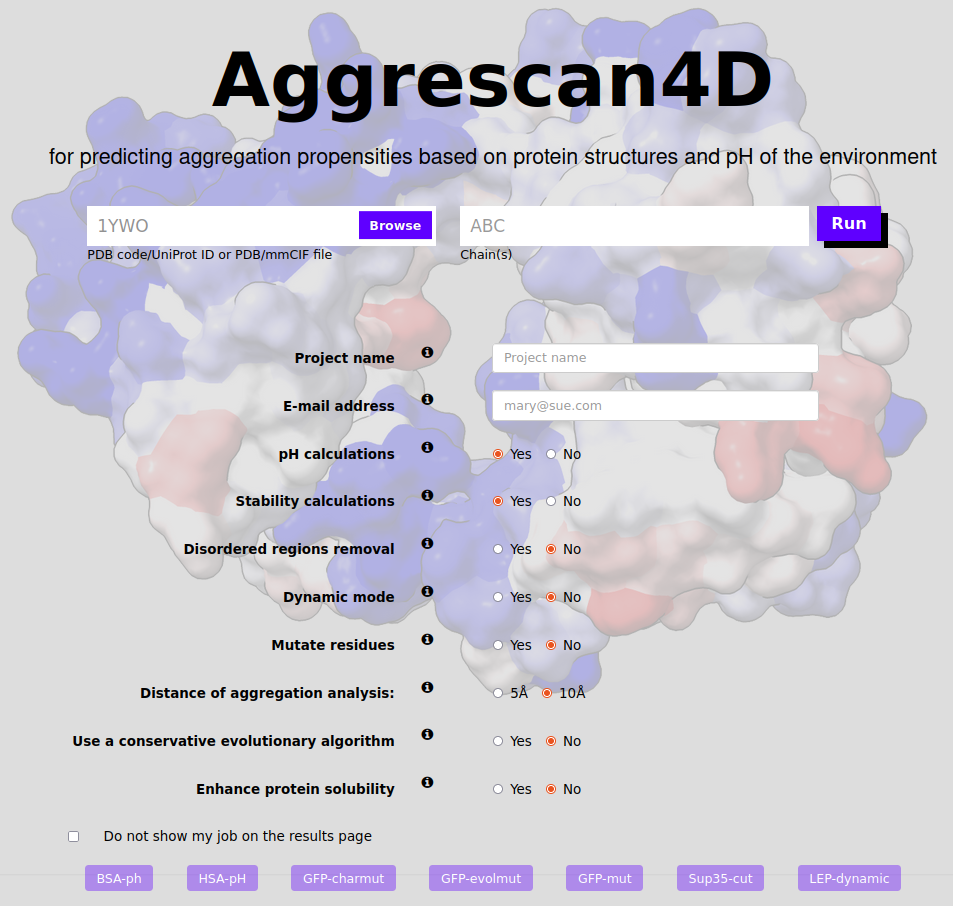
Submit options
In order to submit the job you need to provide the input structure in the input structure panel in the form of either:
- PDB structure code
- protein structure file (in PDB or mmCIF format)
- optionally a single chain identifier - only this chain will be used in the simulation
In the Options panel there are several additional options to be chosen:
- Project name - the name under which the project will be displayed (and which can be used to find it via the project name search on the top of the page).
- Email address - provided an email address the server will notify the user when the job has started and ended.
- pH calculations - default option to run pH-dependent aggregation predictions at 11 different pH values (from 4 to 9, step size 0.5).
- Stability calculations - if selected the submitted structure will be energetically minimized before the A4D analysis using the FoldX forcefield.
- Analysis of the globular regions - If selected, the server will use AlphaCutter to automatically select globular regions for the predictions, leaving aside intrinsically disordered regions.
- Dynamic mode - In this mode the input structure's dynamics will be simulated using the CABS-flex software and likely conformational fluctuations analysed and scored for aggregation propensity. Note: this option cannot be used alongside enhance protein stability option or pH mode.
- Mutate residues - If selected this mode allows the user to select residues and perform point mutations on the wild type which are built using the FoldX forcefield. Selecting this option will prompt a new window. See "How to mutate a residue?" for a tutorial to the next step. Note: this option cannot be used alongside enhance stability option or pH mode.
- Distance of aggregation analysis - In the A4D method the intrinsic aggregation propensity of each particular amino acid in the structure is modulated by its specific structural context. Aggregation propensity is calculated for spherical regions centred on every residue Cα carbon. This options allows to change the size of said region allowing for more and less granular approaches.
- Enhance protein solubility with charged mutations - In this mode the input structure is optimized using FoldX and the most aggregation-prone residues identified according to their A4D score. These residues are individually mutated to solubilizing charged amino acids (arginine, aspartic acid, glutamic acid and lysine), Selecting this option will prompt a new window to open upon submitting where the user can prevent chosen residues from being mutated. See "How does the enhance protein solubility option work?" for a tutorial to the next step. Note: this option cannot be used alongside mutate or dynamic options or pH mode.
- Improve protein solubility with evolutionary conserved mutations - Similar mode to the previous one but now automated mutations are applied using an matrix of evolutionary conserved residues to better account for natural mutations that could be more frequent along evolution. Note: this option cannot be used alongside mutate or dynamic options or pH mode.
- Do not show my job in the results page - if the box is ticked the job will not be visible to other A4D users.
Interpreting the results
When a job is successfully submitted the user is redirected to a summary page where all the project details are available. This is also the place where the results are available once the calculations are finished. Depending on the chosen options several tabs will be available.The "Project details" tab.
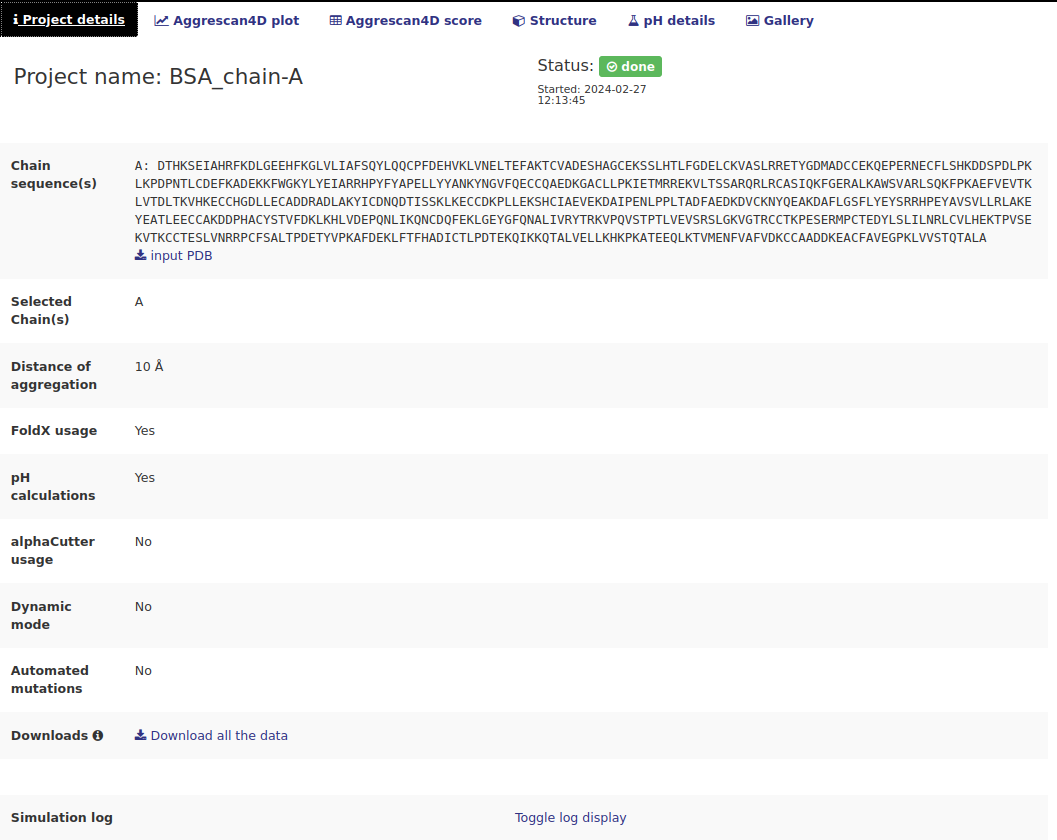
This tab contains information about the specified options used to run the job. It also contains some interactive links:
- Input PDB download link in the Chain sequence(s) row.
- Download all the data link in the Downloads row - download all the data produced during the simulation as a tar.gz archive. This includes all the dynamic mode models, mutants from automated mutations, etc.
- Toggle log display - when clicked a simulation log produced by A4D standalone will be displayed.
The "Aggrescan4D plot" tab.
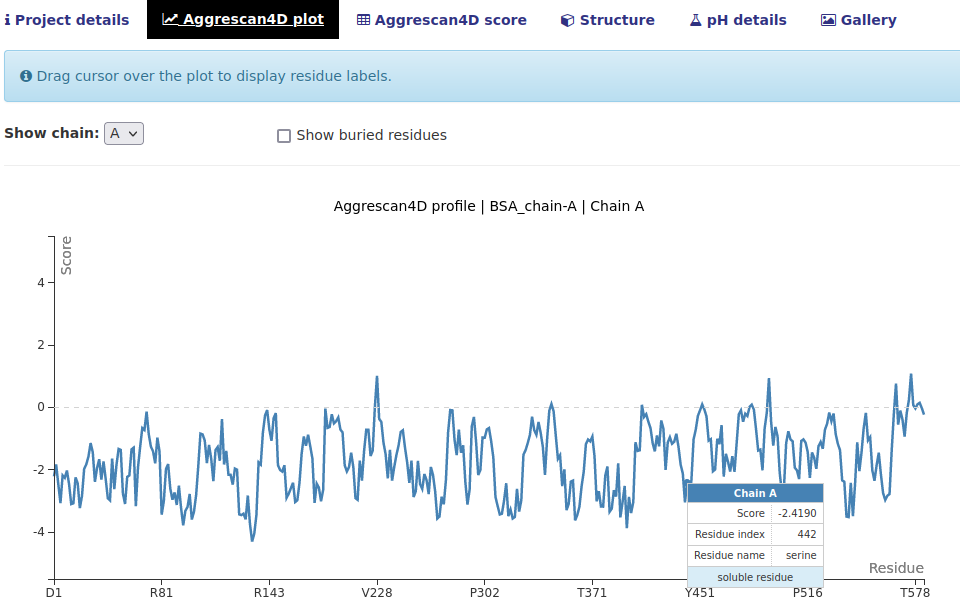
In this tab a single-chain plot breaking down the A4D scores for each residue is shown. There are several options:
- Mouse over a point to see a detailed description.
- Select the chain that is displayed in the Show chain dropdown menu.
- Tick the "Show buried residues" box to also show the residues with A4D score equal to 0; considered buried which have negligible influential to the aggregation propensities.
The "Aggrescan4D score" tab.
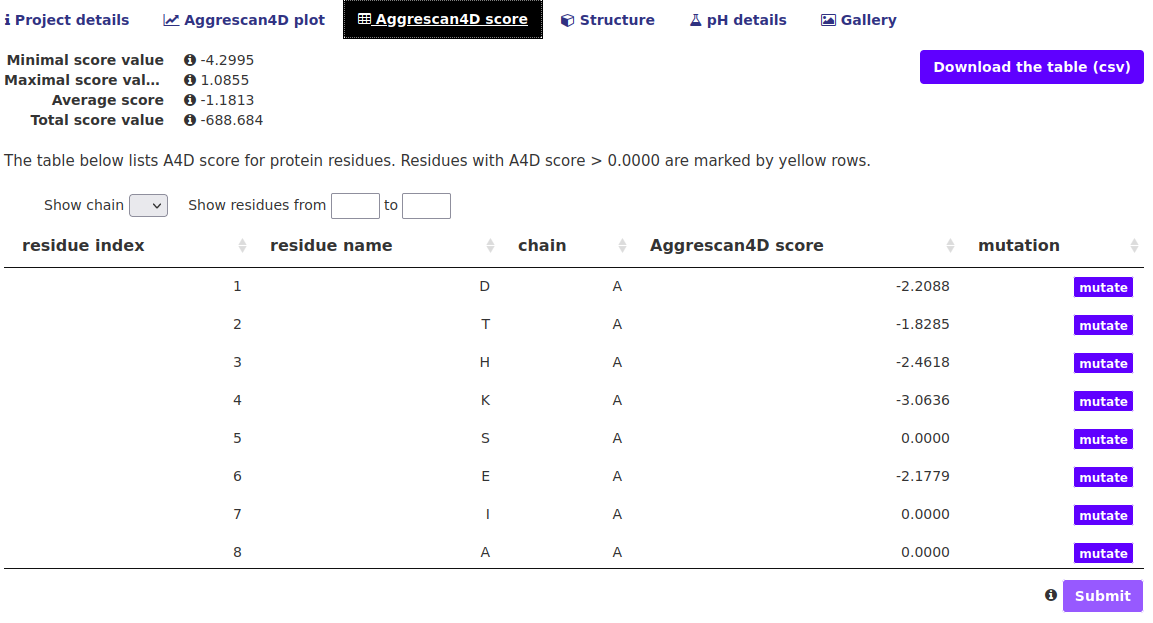
In this tab the A4D score breakdown is presented in an interactive table. The table can be restricted to show only residues from a certain chain or within a given index range. Additional options include:
- Download the table button - download a csv file with A4D scores for each residue obtained from regular A3D equation.
- "mutate" buttons in the right side of the table - If the user wishes to re-submit the same structure but mutate chosen residues they can do so easily using these buttons. A box will appear with a list of amino acids which can be chosen from. Once all the desired mutations are selected hit the Submit button beneath the table.
The "Structure" tab.
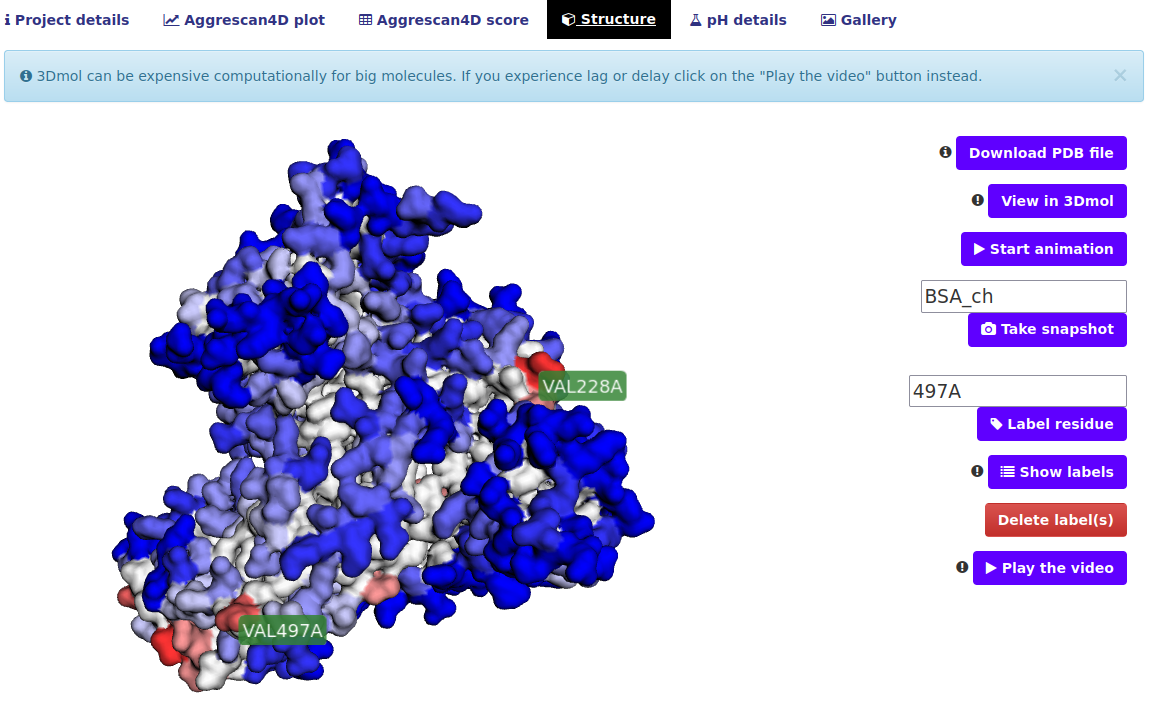
In this tab the user can view the final structure in an interactive way. The residues are colored according to their A4D score, ranging from blue, which implies a soluble residue, to various red shades indicating aggregation prone residues.. Several ways of interacting with the visualization are available:
- View in 3Dmol button - the default view is the 3Dmol viewer, this button can be used to get back to the original view after switching to the video view.
- Start animation - the structure will start rotating for a better view
- Take snapshot input and button - This button allows the user to take a snapshot of the viewed structure. User can specify a snapshot name or have the name automatically assigned based on the project name ("1ywo_e" in this example); a link to directly download the image will be presented The snapshot will remain available in the "Gallery" tab.
- Label residue input and button - Type in a residue or a list of residues in a format of ResidueID+ChainID i.e. 12A, 13B. Upon hitting the button A label will be placed on the structure as shown on the screenshot.
- Show labels button - shows the labels of all aggregation prone residues.
- Delete label(s) button - a list of currently shown labels will appear they can be deleted from the view.
- Play the video button - plays a short video of the structure replacing the current view.
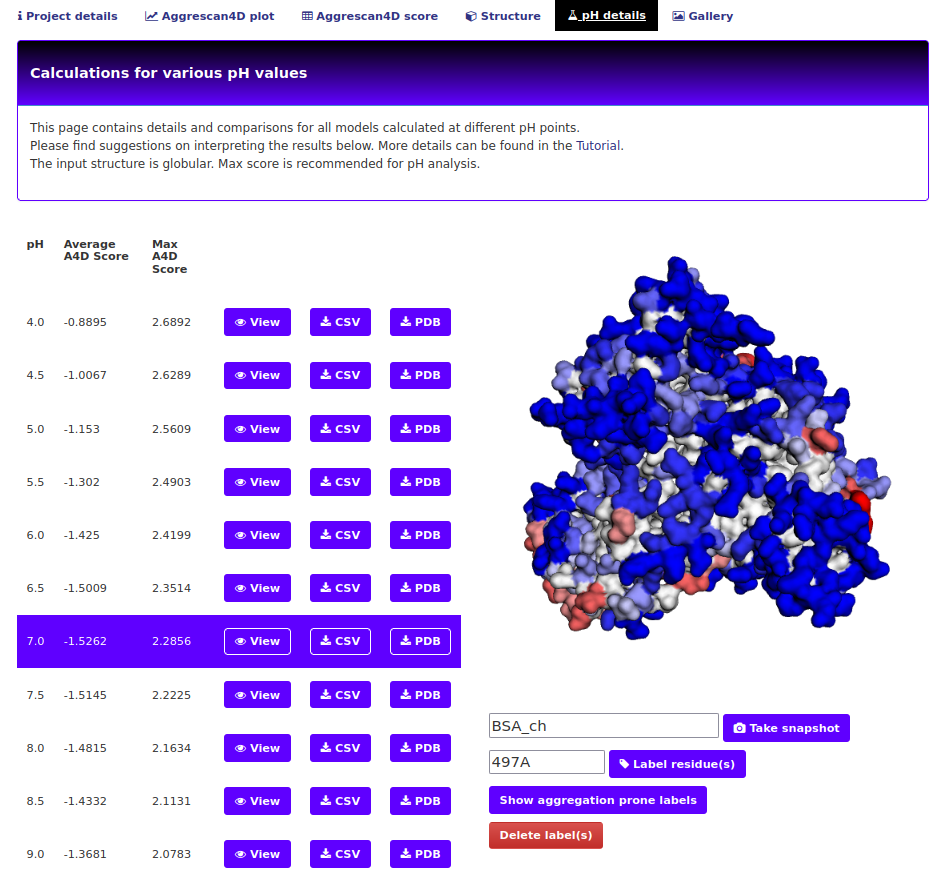
The "pH details" tab.
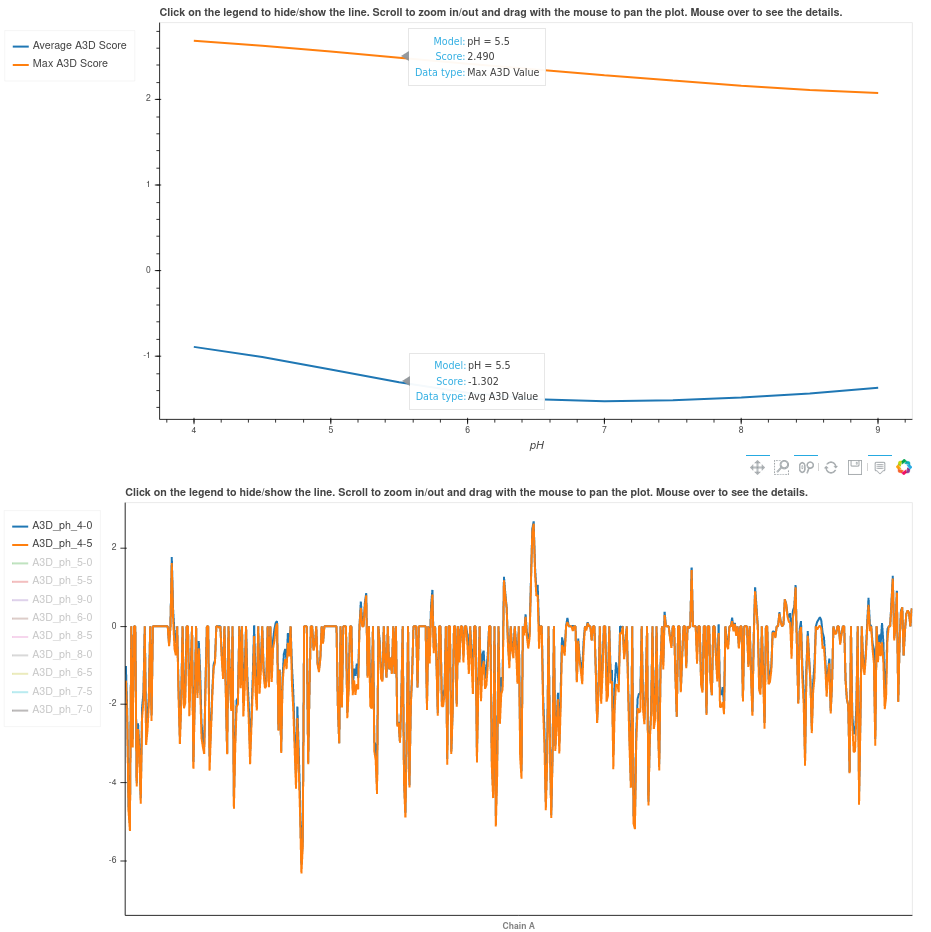
If the default pH mode is not unselected, prediction results for 11 different pH are shown in the pH tab from pH 4 to pH 9 with a step size of 0.5. Each single prediction can be visualized in the structure upon clicking on the View button next to each entry. For globular proteins, we recommend using the A4D maximum score as the reference metric since it better correlates with experimental results. For IDPs we recommend A4D average score instead. A4D already recognizes the input structure and recommends the metric to use. Below the structure, two different plots are displayed. The first one shows the A4D max/avg score for each pH and the second one the per-residue score. Users can select the metric/pH to visualize by clicking on the legend label(s) on the left. The remaining tabs (structure, scores, plot) correspond to regular predictions with the original A3D scoring which are provided for the purpose of comparison with pH details.
The "Dynamic mode details" tab.
This tab is only available when dynamic mode was chosen. The first part of this tab is an interactive viewer similar to the one in Structure tab and a table comprising models produced by CABS-flex and their A4D scores as well as the input structure:
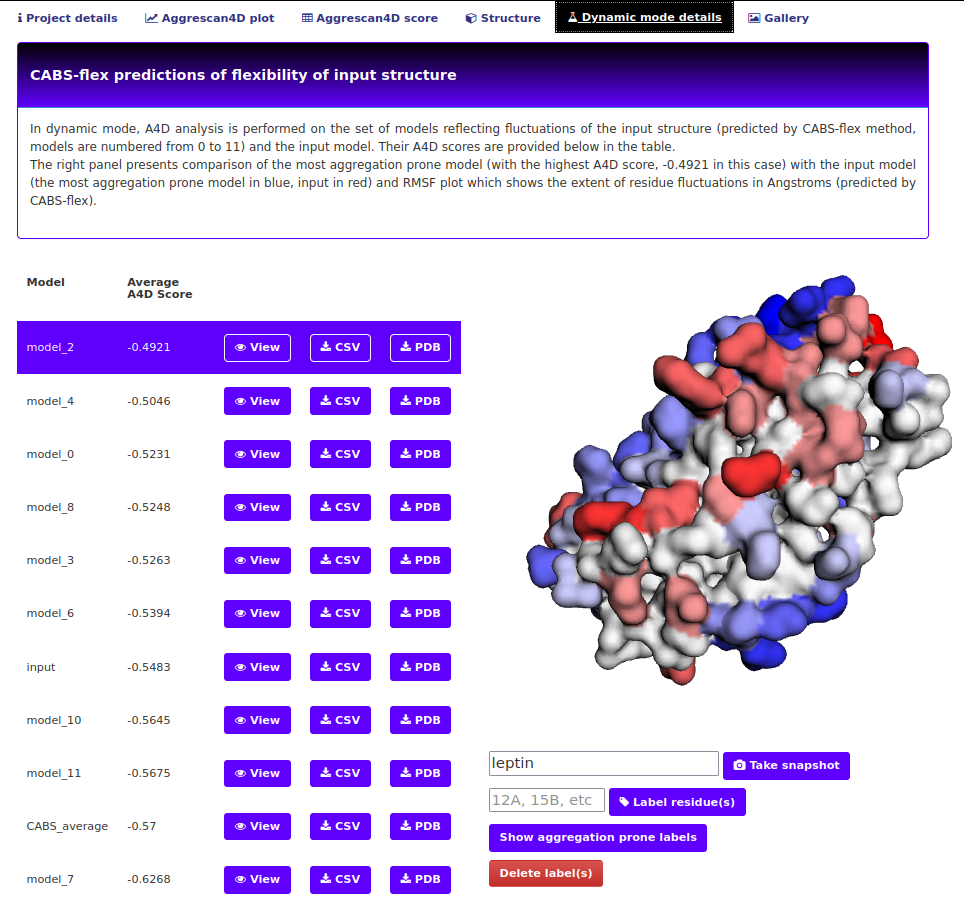
The controls of the viewer are the same as explained above. The table offers some additional options:
- View buttons - click on the button next to the desired model name to switch to its view.
- CSV buttons - download the score summary for the model in a csv format
- PDB buttons - download a PDB file for the model with A3D score in the occupancy field.
The default controls of the plot allow for zooming in and out with the mouse wheel as well as draging the plot while holding the left mouse button. On the bottom of the plot there are square zoom for precisely selecting the zoomed in area and a reset button to revert all the changes. Click on the legend items to hide/show the plots for chosen models.
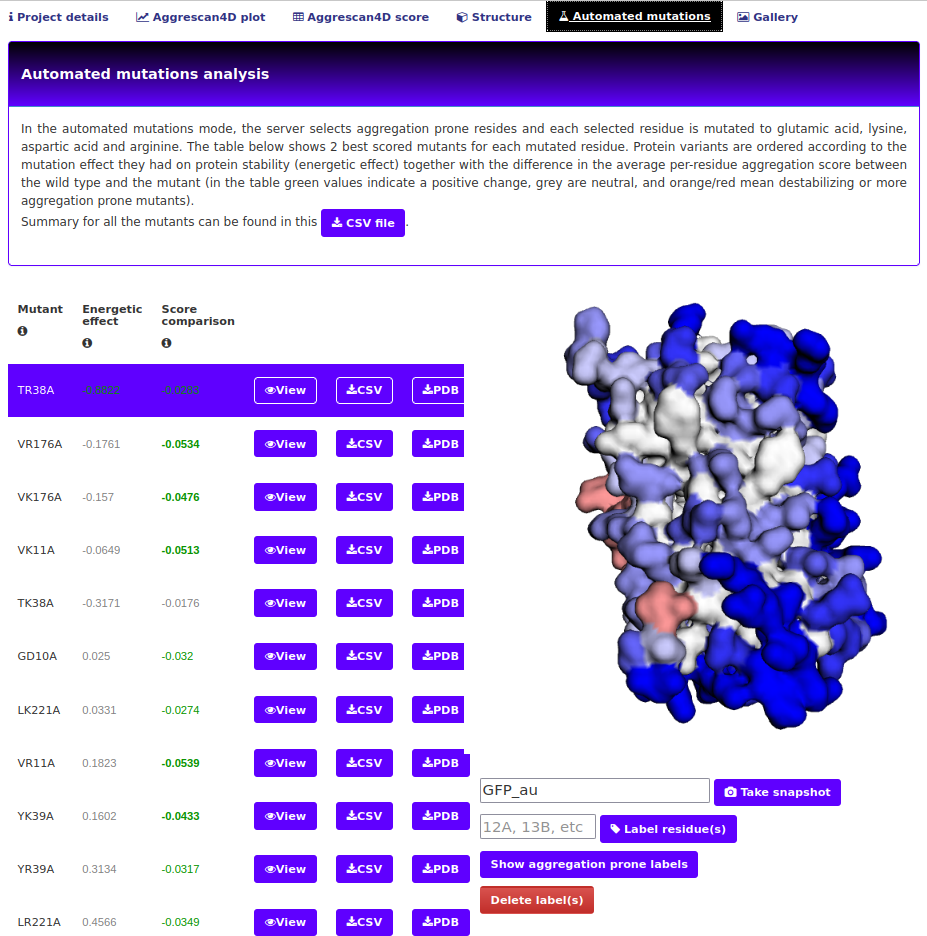
The "Automated mutations" tab.
This tab is only available when the enhanced protein solubility option mode (either with charged or evolutionary conserved mutations) was chosen. The first part of this tab is an interactive viewer similar to the one in Structure tab and a table comprising the mutants created and chosen during the simulation process. The controls are identical to those described in the "Dynamic mode details" tab.
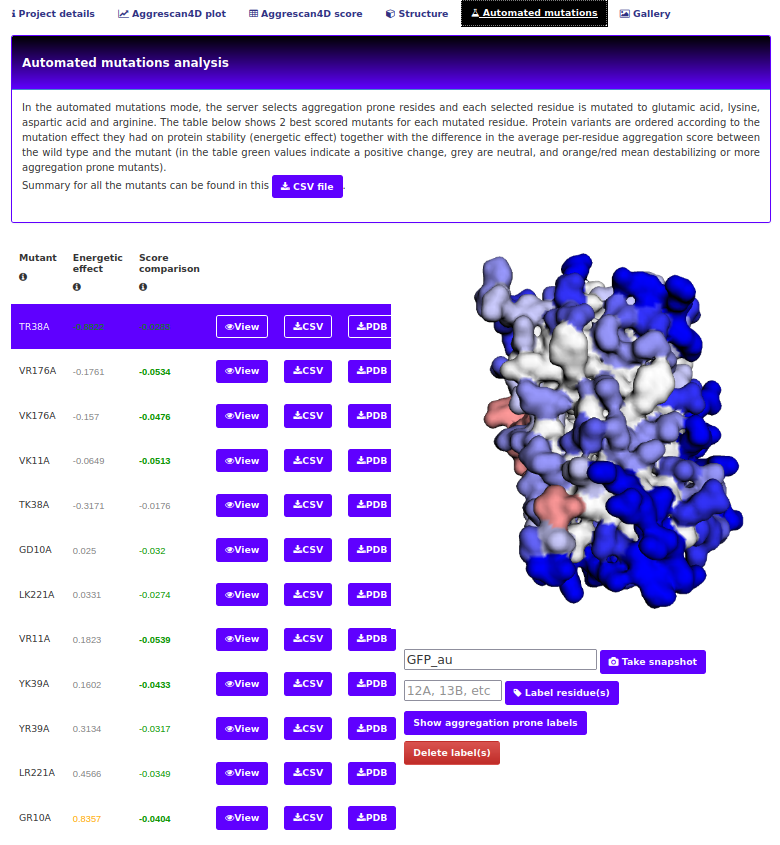
CSV file button starts the download of a CSV file. This contains the energetic effect of mutation, A4D score and a difference in average residue's A4D score, compared to the wild type structure. Suboptimal mutants omitted in the interactive presentation will also be present in the file.
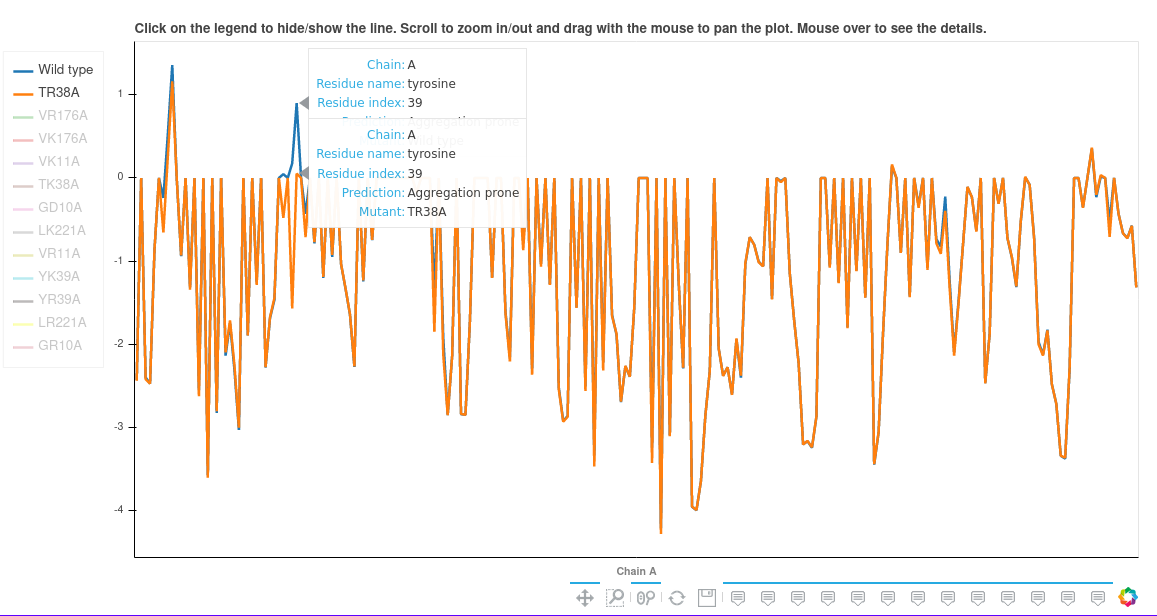
The second part again contains an interactive plot of the mutants and the wild type. The controls are identical to those described in the "Dynamic mode details" tab.
The "Gallery" tab.
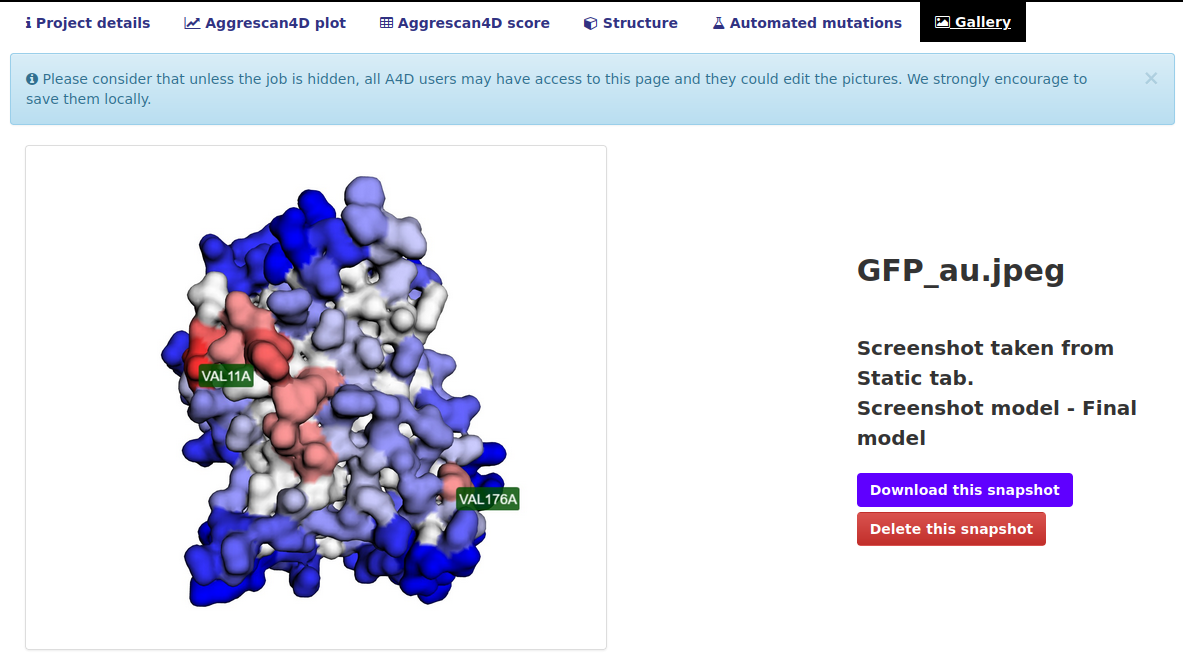
This tab contains all the screenshots taken by the users in this project. Please consider the fact that anyone can delete your screenshots so we strongly encourage to also save them locally. The system can store up to 40 pictures for each project.
How to interpret the pH results?
In the pH tab, 11 different predictions are shown from pH 4 to pH 9 with a step size of 0.5 (unless the user disables the pH calculations mode). For globular proteins, we recommend using the A4D maximum score as the reference metric since it better correlates with experimental results. For IDPs we recommend A4D average score instead. We rationalize that maximum scores account for highly structural aggregation prone regions in the surface of globular proteins whereas the average scores consider aggregation propensity distributed along exposed disordered sequences. A suggestion of the metric that should be used is provided in the pH details box. This metric is based on an underlying quantitative measure that captures the compactness of the protein structure.
Below the structure, two different plots are displayed. The first one shows the A4D max/avg score for each pH and the second one the per-residue score. Users can select the metric/pH to visualize by clicking on the legend label(s) on the left.
*Note: the remaining tabs (structure, scores, plot) correspond to regular predictions with the original A3D scoring which are provided for the purpose of comparison with pH details.
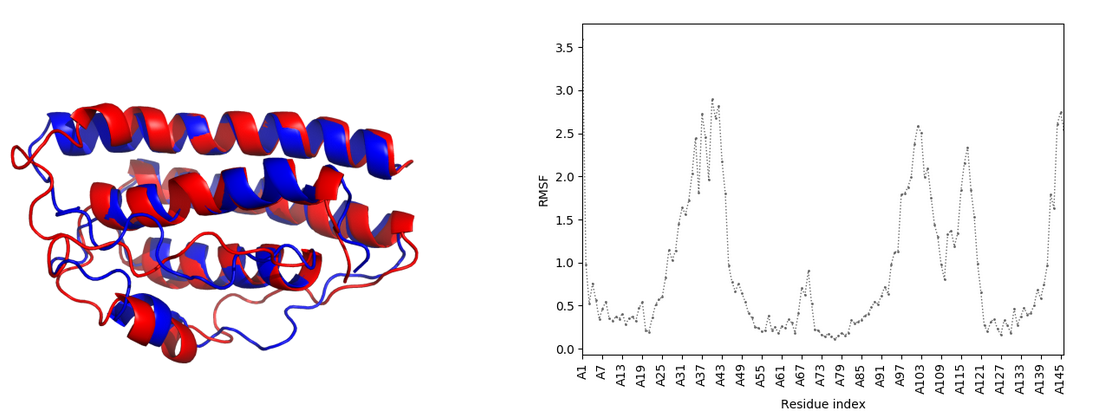
What is the dynamic mode?
In this mode, A4D exploits the CABS-flex approach for the fast simulations of near-native dynamics of globular proteins. The aggregation properties of the ensemble of protein models are analysed, scored and presented to the user in an interactive way with tools available to compare the CABS-generated models to the input (or mutant) structure. This mode is intended to give the user an insight into the dynamic structural fluctuations that a protein experiences in the solution and their influence on its aggregation propensity, promoting partial exposure of usually buried residues. In this way, mutations leading to destabilized protein variants with increased conformational fluctuations usually have a huge impact on the aggregation propensity of the protein.How to mutate a residue?
Upon selecting the mutation option and running the job the user is redirected to a new page that looks like the one below: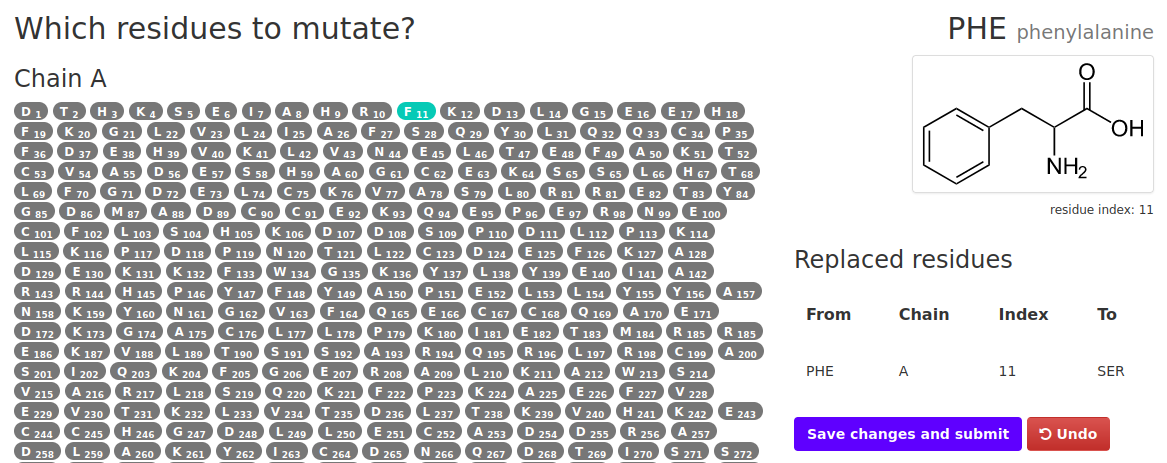
In order to to mutate a residue:
- Select a residue you wish to mutate from the list and click it.
- A small window will appear where amino acids will be listed. Select the one you wish to mutate the original one to.
- The residues selected for mutation will appear in the table on the right. If a mistake was made simply hit "Undo".
- When everything is done click on the Save changes and submit. You will be redirected to the job summary page.
How does the enhanced/improved protein solubility option work?
In this mode the input structure is optimized using FoldX and the most aggregation-prone residues identified according to their A4D score. These residues are individually mutated to either solubilizing charged amino acids (arginine, aspartic acid, glutamic acid and lysine) or evolutionary conserved residues (PAM250 matrix), depending on the mode selected. Users can specify positions to be excluded from the automated mutation (optional). The changes in aggregation propensity and stability are calculated for each potential point mutant and short-listed according to these values, up to a maximum of 12 suggested changes. Only the two most solubilizing mutations for each particular position are included in the short-list, in order to maximize the number of residues that can be potentially engineered (up to 6).Upon selecting this option and hitting "Run" the user is redirected to a new page:
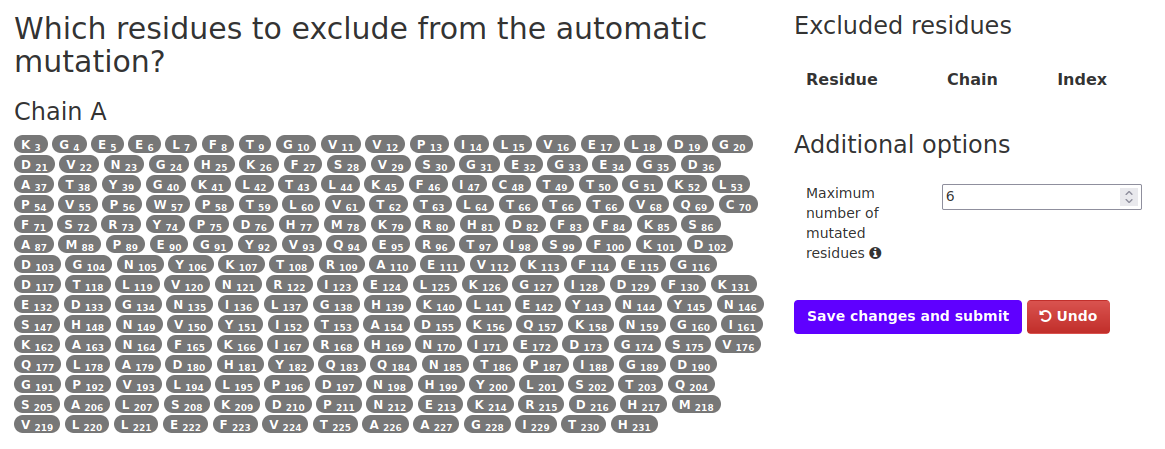
In order to to run the simulation:
- Select any residues that you don't want mutated in the process (not required).
- The residues excluded from the process will appear in the table on the right. If a mistake was made simply hit "Undo".
- Select the maximum number of residues that will be mutated. Max is 6 and minimum is 1. Note that only aggregation prone residues will be selected in the simulation so the final number might vary from the one selected here.
- Once options fulfill user's needs, click on the Save changes and submit. You will be redirected to the job summary page.
The results page will show the most convenient mutations considering both score comparison and energetic effect, which can be visualized in the structure.
Working with globular regions only
A4D incorporates the option of using the AlphaCutter algorithm to remove intrinsically disordered regions whose predictions might not reflect the real protein’s aggregation propensity. For this reason, users can activate the option of analysis of the globular regions from the submission page. The resulting output will only show predictions for the globular moiety of the protein. In the project details users can visualize which residues have been removed (in red) and not included in the final predictions.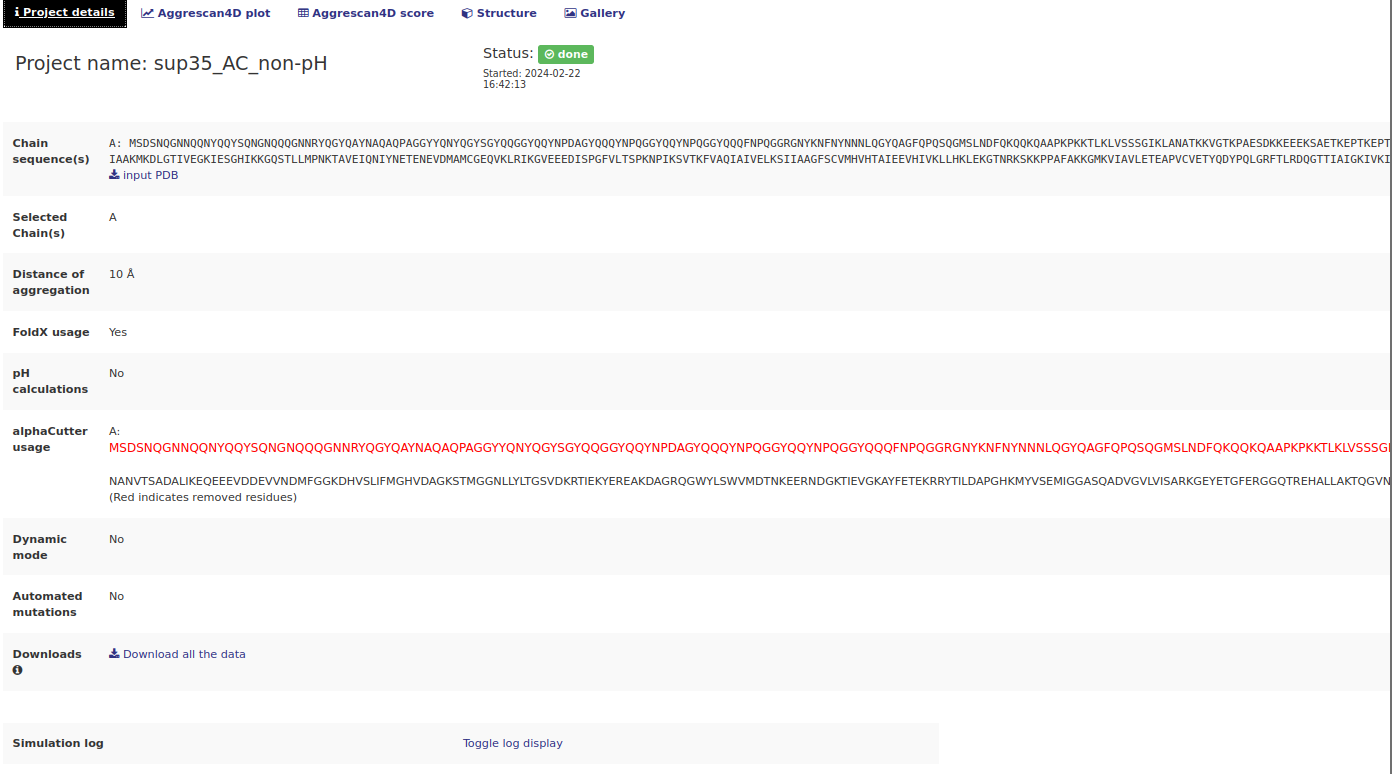
RESTful service - how to submit a job
RESTful URLs
Aggrescan3D 2.0 webserver may be operated through RESTful services, using following URIs:
https://biocomp.chem.uw.edu.pl/a4d/RESTful/submit/1ywo/submit new job (1ywo pdb entry)https://biocomp.chem.uw.edu.pl/a4d/RESTful/submit/userinput/submit user pdb file (details below)https://biocomp.chem.uw.edu.pl/a4d/RESTful/submit/1ywo/chain/A/submit new job (chain A of 1ywo pdb)
Options
The RESTful service allows for full project customization. A list of available options is presented below. Note: if no value is provided the default value is used.name- project name. Default: randomly generated string (jobid).email- email (info about job will be send to this email). Default: Noneph("True"or"False") - Calculate A3D scores at various pH values.Default: True.foldx("True"or"False") - use FoldX for stability calculations.Default: True.alpha_cutter("True"or"False") - Use the AlphaCutter to remove the disordered regions of the protein.Default: False.distance("10"or"5") - distance of aggregation. Default: 10.dynamic("True"or"False") - use dynamic mode. Default: Falsehide("True"or"False") - if True - do not show job on the queue page. Default: Truemutate- list of residues to mutate before A3D analysis. This option will Illustrated in the code snippets. Default: Noneauto_mutation- selected this option to automatically enhance protein stability. Read more. Default: Noneauto_evolve- Automatically select mutation targets and mutate them into several amino acids using a conservative evolutionary apporach. Read more. Default: None- Note: ph and dynamic options are mutually exclusive.
- True - use the default settings (attempt to mutate 3 residues)
- "4 3" - Try to mutate 4 residues using 3 CPU cores. Maximum allowed is 6 residues and 3 cores.
- "4 3 1A 13A 3P" - Same as above except prevent residue 1 from chain A, 13A and 3P from being mutated.
- Note: auto_mutation cannot be used along with ph option (which by default is True), regular mutation or dynamic modes.
- The auto_mutation and auto_evolve options can be submitted with several arguments:
Submitting via Python script
A Python script including custom options that could be used to submit a PDB code:
import requests
import json
# define which residues to mutate. If the specified residues do not exist within the pdb file
# the server will respond with an error (code 400).

mutation_table = [{'idx': "1", 'chain': 'A', 'oldres': 'I', 'newres': 'W'},
                  {'idx': "2", 'chain': 'A', 'oldres': 'D', 'newres': 'W'}]

# specify additional options
options = {'dynamic': False,
           'distance': 5,
           'email': 'mary@sue.com',
           'name': 'REST_test',
           'hide': False,
           'mutate': mutation_table,
           'foldx': True,
	   'ph': True,
	   'alpha_cutter': False,
           'auto_mutation': "2 2"}

req = requests.post('https://biocomp.chem.uw.edu.pl/a4d/RESTful/submit/1ywo/',
                    data=json.dumps(options),
                    headers={'content-type': 'application/json'})

print(req.status_code)  # Print the HTTP code. 200 = OK. 400 = server recognises the problem, 404 = bad.
print(req.text)         # Print the Response - explained below
A Python script including custom options that could be used to submit a custom PDB file:
import requests
import json
# define which residues to mutate. If the specified residues do not exist within the pdb file
# the server will respond with an error (code 400).

mutation_table = [{'idx': "1", 'chain': 'A', 'oldres': 'I', 'newres': 'W'},
                  {'idx': "2", 'chain': 'A', 'oldres': 'D', 'newres': 'W'}]

# specify additional options
options = {'dynamic': False,
           'distance': 5,
           'email': 'mary@sue.com',
           'name': 'REST_test',
           'hide': False,
           'mutate': mutation_table,
           'foldx': True,
           'auto_mutation': "2 2"}
# send the request, note that the test.pdb file has to be in the same directory as this script
req = requests.post('https://biocomp.chem.uw.edu.pl/a4d/RESTful/submit/userinput/',
                    files={'inputfile': ("file", open('test.pdb', 'rb')),
                           'json': (None, json.dumps(options), 'application/json')})

print(req.status_code)  # Print the HTTP code. 200 = OK. 400 = server recognises the problem, 404 = bad.
print(req.text)         # Print the Response - explained below
Submiting with other tools
Other tools can be used to submit the job, as long as they are capable of POST'ing requests. Below is an example of using curl available for most unix systems for users who prefer bash scripting:
curl -i -X POST -d '{"email": "mary@sue.com", "dynamic": "True", "name": "some project name"}' -H 'Content-Type: application/json' https://biocomp.chem.uw.edu.pl/a4d/RESTful/submit/1ywo/Interpreting the server response
The responses might vary depending on the tool used, here we will focus on the Python scripts presented above
- If the submission is successful the output should look like the one below (except a different jobid will be assigned).
200 { "jobid": "a0ae2bb71feeaf0", "status": "submitted" } - If for example the options include both dynamic and auto_mutate options the output would look like:
400
Auto mutation cannot be selected with dynamic nor mutate
- Some errors will not be parsed and indicate that the submit script is not correct. the answer then looks like:
404

<!doctype html>
<html lang='en'>
[...]
RESTful service - download results
URLs that provide informations about existing jobs
https://biocomp.chem.uw.edu.pl/a4d/RESTful/job/yourjobid/status/- Check job statushttps://biocomp.chem.uw.edu.pl/a4d/RESTful/job/yourjobid/structure/- Get output structure with A3D values in the temperature factor columnhttps://biocomp.chem.uw.edu.pl/a4d/RESTful/job/yourjobid/- Get full information about submitted job (see explained in details below)
Check the job status
The job status can take on 5 values: pending, queue, running, error and done. See the project status in this tutorial for more explanation.
An example Python script to check the job status:
import requests
req = requests.get('https://biocomp.chem.uw.edu.pl/a4d/RESTful/job/yourjobid/status/')
try:
    data = req.json()
    print(data)
except ValueError:
    print("The server responded but the jobid was not found")
The likely response is:
{'status': 'done'}
Get the output pdb file
An example Python script that would save the result A3D pdb file to rest_job.pdb if the job is done:
test = requests.get('https://biocomp.chem.uw.edu.pl/a4d/RESTful/job/yourjobid/status/')
if test.json()["status"] == "done":
    req = requests.get('https://biocomp.chem.uw.edu.pl/a4d/RESTful/job/yourjobid/structure/')
    with open("rest_job.pdb", "w") as f:
        f.write(req.text)
else:
    print("Job not yet done")
Full A3D output
To get full information about submitted job, user may create Python script like:
import requests

req = requests.get('https://biocomp.chem.uw.edu.pl/a4d/RESTful/job/somejobidentifier/')

print(req.status_code)
data = req.json()
for k in data.keys():
    print("key: %s: %s" % (k, data[k]))
getting output similar to:
200
key: chain_sequence: GSFTMPGLVDSNPAPPESQEKKPLKPCCACPETKKARDACIIEKGEEHCGHLIEAHKECMRALGFKI
key: status: done
key: mutated_residues: None
key: dynamic_mode: 0
key: automated_mutations: 2 3
key: stability_calculations: 1
key: mutation_energetic_effect: 0.0
key: mutation_mode: 0
key: started: 29 Jan 2019 13:19:05 GMT
key: updated: 29 Jan 2019 13:24:00 GMT
key: project_name: your_job_name
key: aggregation_distance: 10
key: aggrescan3Dscore: {u'max': 1.664,
                        u'sum': -95.41120000000001,
                        u'min': -4.1893,
                        u'avg': -1.424,
                        u'tab': [[[u'5', u'S', u'A', u'-0.3282'], [u'6', u'A', u'A', u'-0.1352'], ... ]}
key: auto_mut: {u'IE28A': [1.0209, -0.6262, -0.0538],
                u'VD4P': [-0.042, -0.6319, -0.0595],
                u'IR28A': [0.8208, -0.6252, -0.0528],
                ...}
Explaining some of the tabs:
-
The aggrescan3Dscore:
- max - maximum score for a single residue
- min - minimum score for a single residue
- sum - summary score for all residues
- avg - average score for all residues
- tab - a list of lists with A3D score for each residue. The list is formatted as follows: [ID, CODE, CHAIN, SCORE]
- The auto_mut - a dictionary with keys - mutation codes and values - lists formatted as follows: [energetic effect, average score, difference in average score to wild]
Interacting with the full output
Example script interacting with the output is presented below.
import requests

req = requests.get('https://biocomp.chem.uw.edu.pl/a4d/RESTful/job/yourjobid/')

data = req.json()   # Get the data as a json
a3d = data['aggrescan3Dscore']  # Select the aggrescan3Dscore for analysis

print("AVG A3D: %s" % (a3d['average_value'])) # print the average value - care the data is all strings at this point
print("MIN A3D: %s" % (a3d['min_value']))

for row in a3d['table'][:6]:
    print(row[0], row[3])
to get output like:
AVG A3D: -1.424
MIN A3D: -4.1893
(u'1', u'-0.3367')
(u'2', u'0.3541')
(u'3', u'1.6640')
(u'4', u'0.8468')
(u'5', u'1.2976')
(u'6', u'0.5633')
Download the data
Example script to download all the files for a given job:
import os
import requests

test = requests.get('https://biocomp.chem.uw.edu.pl/a4d/RESTful/job/yourjobid/status/')
if test.json()["status"] == "done":
    req = requests.get('https://biocomp.chem.uw.edu.pl/a4d/RESTful/job/all_data/jourjobid')
    with open(os.path.join(os.path.dirname(os.path.abspath(__file__)), "a3d.tar.gz"), "wb") as f:
        f.write(req.content)
else:
    print("Job not yet done")
Running this script would download a `a3d.tar.gz` file to the directory of the script. The file contains all of the files from the job ran.
Depending on the options for the job this archive might have different conatents. Extracting the file should yield:
- A3D.csv (Always) - The output csv with Aggrescan scores for each residue
- input.pdb (Always) - The input file for the program
- output.pdb (Always) - The output file generated by the program.
- Aggrescan.log (Always) - The log file generated by the program.
- config.ini (Always) - The config file with which the aggrescan program was ran.
- X.png + X.svg (Always) - There can be multiple of these files. X stands for the chain and there are two files for each chain in the output pdb file.
- A3d_summary.json (Always) - json file with detail on min, max etc aggrscan values for each chain and the entire protein
- A3d_summary.json (Always) - json file with detail on min, max etc aggrscan values for each chain and the entire protein
- ph_log.json (with ph) - json file with detail on min, max etc aggrescan values for each chain and the entire protein at various pH values
- A3D_ph_X-Y, output_ph_X-Y (with ph) - same as A3D.csv and output.pdb except X-Y denote the pH value for which the file was generated
- model_x.pdb, model_x.csv (with dynamic) - same as A3D.csv and output.pdb except x denote the model
- CABS_average.csv, CABS_average.pdb (with dynamic) - same as A3D.csv and output.pdb except for the averaged CABS model
- CABSflex_rmsf.csv, CABSflex_rmsf.png (with dynamic) - plot and source data for the root mean square fluctuation from the CABS program.
- CABSflex_supe.png (with dynamic) - presents comparison of the most aggregation prone model and input model superimposed
- For automated mutations csv and pdb files will be generated one for each mutant model. The name will indicate the mutation that was used.