Accessing and interpreting results
For users convenience results data is divided into four separate tabs:
1. Summary tab
2. Templates tab
3. Trajectory tab
4. Structure predictions tab
However the most useful functions are accessible from all of the tabs:
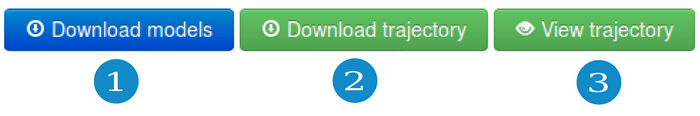
Use the buttons presented above for:
- (1) downloading resulting models (clusters representatives) compressed into the single zip file (see "Clustering data" section for the details).
- (2) downloading the trajectory PDB file (Cα trace only) from the lowest temperature replica
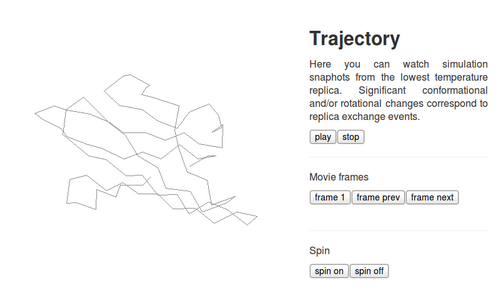
- (3) opening Jmol applet which shows simulation snapshots from the lowest temperature replica (see the screenshot below).
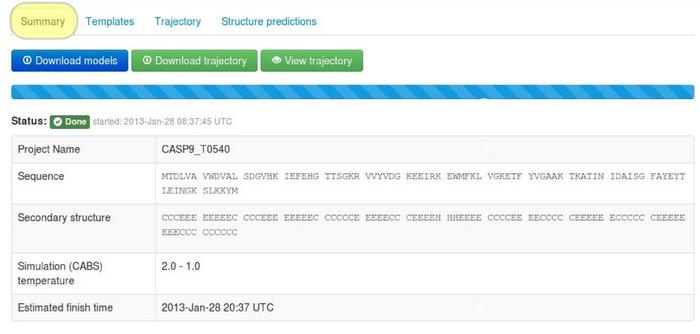
1. Summary tab
The tab contains information about the job parameters.
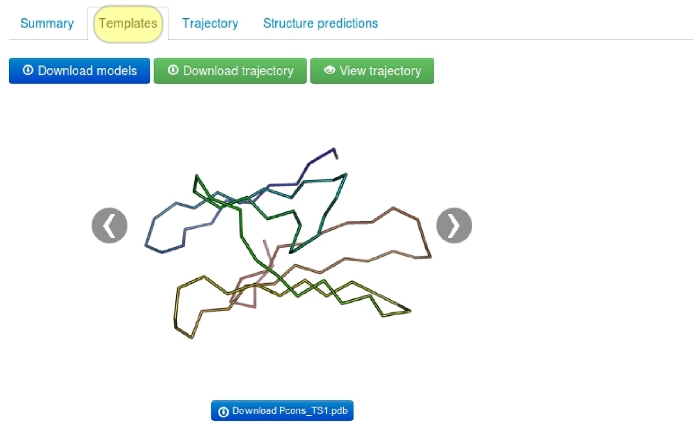
2. Templates tab
In this tab user can see visualizations of the templates (only in consensus modeling mode).
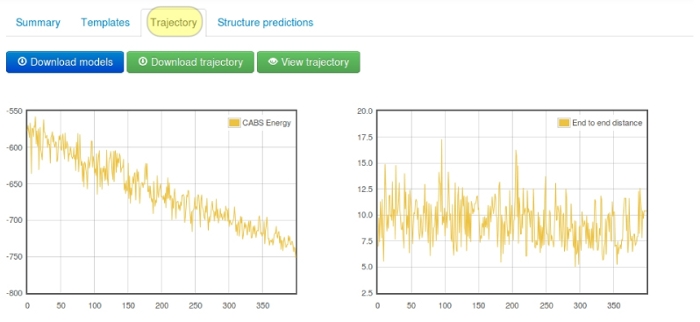
3. Trajectory tab
The tab shows changes of the CABS energy, the radius of gyration and the end-to-end distance for the lowest temperature replica snapshots (these results are also displayed “on-the-fly” during the computation).
4. Structure predictions tab
Under the Structure predictions, results are divided into several sub-tabs:
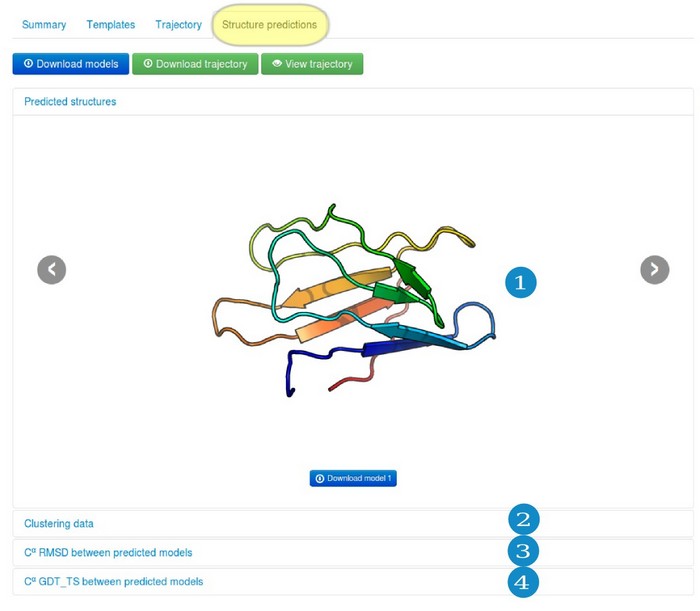
- (1) "Predicted structures" subtab
- (2) "Clustering data" subtab
- (3) "Cα RMSD between predicted models" subtab
- (4) "Cα GDT_TS between predicted models" subtab
4.1. "Predicted structures" subtab
Predicted protein models, presented in this subtab, are each cluster representatives (the clusters and the corresponding models are marked by the same numbers, e.g. Model 1 represents Cluster 1). The clusters (models) are numbered/ranked according to cluster density values, from the most dense (numbered as a first) to the least dense one. See the next subsection for more details.
4.2. "Clustering data" subtab
Clustering of protein models is the task of separating a set of protein models (here a protein dynamics trajectory) into groups (called clusters). The clustering is done in such a way that models are more similar in the same group to each other (here in the sense of RMSD measure), than those in other groups (clusters). In CABS-fold procedure trajectories from the CABS model are clustered using the K-means clustering method.
For each cluster one representative model, either the average cluster structure or a cluster medoid (the model which average dissimilarity to all models in a cluster is minimal), is selected. The choice of the representative model depends on the average cluster RMSD of the densest cluster. If its average RMSD is greater than 2.15 Å the medoid is chosen, otherwise the average cluster structure is selected. Such criterion is the result of our tests which showed that in most cases the choice of the average structure leads to more accurate models (in terms of RMSD or GDT_TS). On the other hand, for clusters containing diverse models, the average structure can be unphysical (due to averaging of the atom positions). Cluster representatives are ranked according to the cluster density (the first one is the densest).
The clusters are numbered/ranked according to cluster density values, from the most dense (numbered as a first) to the least dense one.
The subtab Clustering Data contains a table with the following clusters data:
The clusters are numbered/ranked according to cluster density values, from the most dense (numbered as a first) to the least dense one.
The subtab Clustering Data contains a table with the following clusters data:
- Cluster density values (cluster size divided by average cluster RMSD, rounded to one decimal place),
- Cluster size (numer of models grouped in a cluster),
- Average cluster RMSD (average pairwise Cα RMSD value between models grouped in a cluster, rounded to one decimal place).
See the example table below:
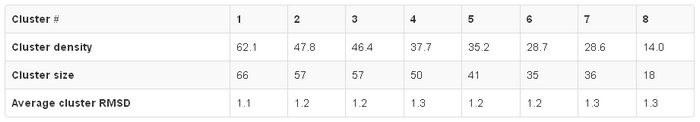
In the example above, the Cluster 1 contains 66 models (selected out of entire trajectory which contains 360 models), whose average RMSD between all pairs of models in the Cluster is 1.1 Angstroms, and the Cluster density is 62.1 (note that the average cluster RMSD value given in the table is rounded to one decimal place, however in the calculation of the cluster density value the exact number is used).
Since the Cluster 1 is the most dense and most numerous, the Model 1 can be considered as the representative of the most dominant conformation in the entire fluctuation ensemble, followed by the Model 2 (representative of the second most dominant structure), and so on.
4.3. "Cα RMSD between predicted models" subtab
The table contains RMSD values (calculated on the Cα atoms) between the predicted models.
Read more about the root-mean-square deviation (RMSD) measure.
4.4. "Cα GDT_TS between predicted models" subtab
The table contains GDT_TS values (calculated on the Cα atoms) between the predicted models.
Read more about the global distance test (GDT, also written as GDT_TS to represent "total score") measure.