This Gallery shows example molecular visualizations of protein structure fluctuations resulted from the CABS-flex server.
Example movies - the CABS-flex automatically generates movies like these for each job run (click to start):
-
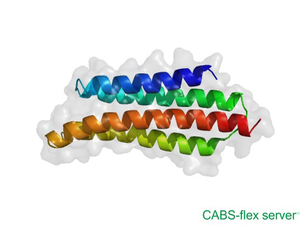 Protein PDB code: 1K40
-
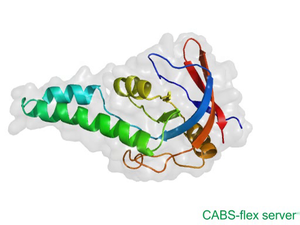
 Protein PDB code: 1HUI
-
 Protein PDB code: 1ASS
-
 Protein PDB code: 1MHN
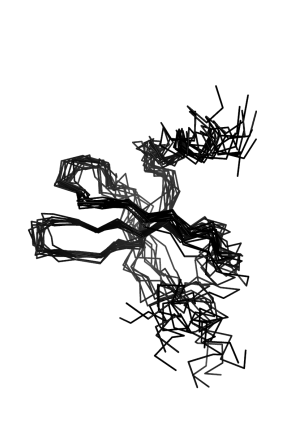
Visualization of stromal cell-derived factor-1 (1SDF) fluctuations (superimposed models from the CABS-flex server), created using PyMOL.
all-atom representation

|
Cα trace representation
|
cartoon representation

|
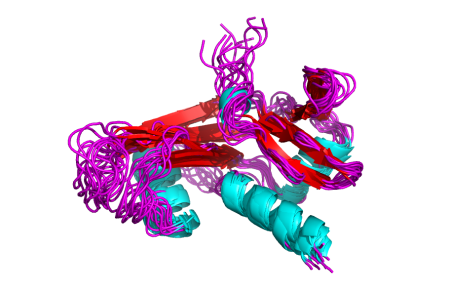
Visualization of bovine angiogenin (1AGI) fluctuations (superimposed models from the CABS-flex server), created using PyMOL (colored according to type of secondary structure: beta in red, alpha in cyan, and loops in magenta).
Cα trace representation
|
cartoon representation

|
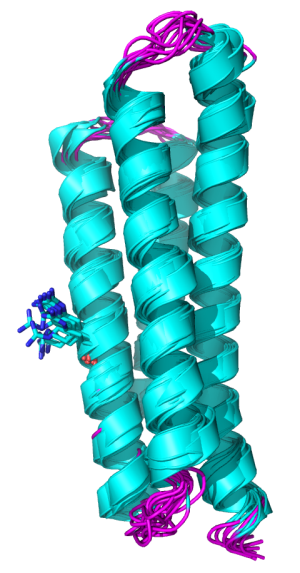
Visualization of FAT domain of focal adhesion kinase (1K40) fluctuations (superimposed models from the CABS-flex server), created using PyMOL (colored according to type of secondary structure: alpha in cyan, and loops in magenta). Additionally, 962ARG side chain was shown (which is one of the residues constituting the interaction site of 1K40).
| cartoon representation | Cα trace representation | all-atom representation for the main chain only and 962Arg side chain |
|

|

|
© Laboratory of Theory of Biopolymers, Faculty of Chemistry, University of Warsaw 2013