Status: Done started: 2018-Oct-15 08:47:00 UTC
| Project Name | |
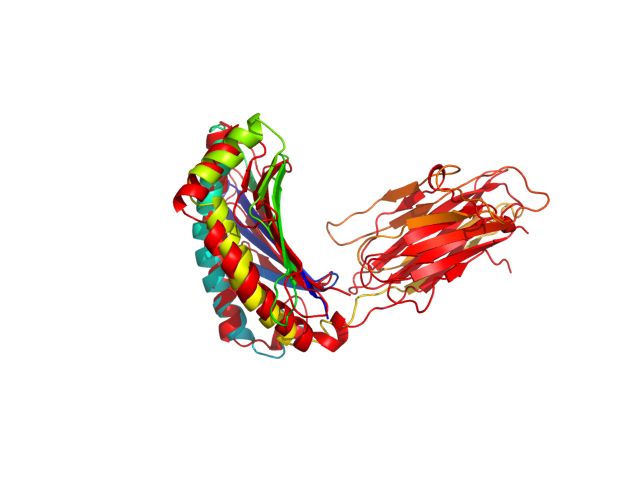
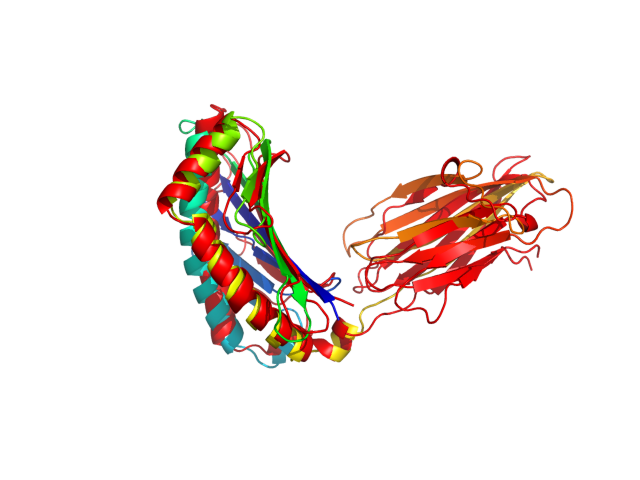
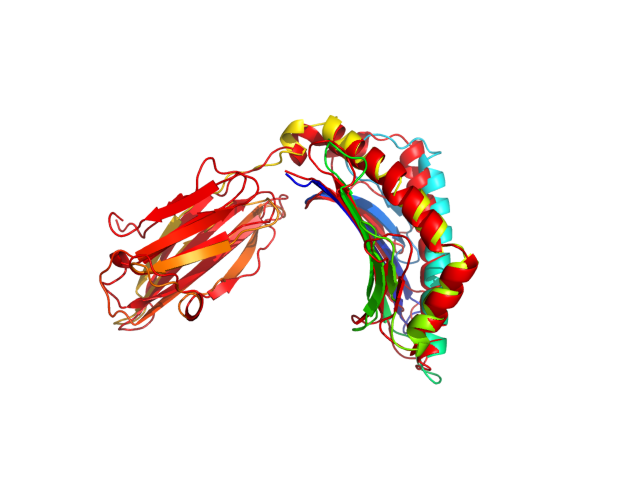
| Sequence | GSHSLRYFHT AVSRPGLREP LFITVGYVDD TQFVRFDSDA RDPRTEPRQP WMEKEGPEYW DRETQISKEN ALWYREALNN LRGYYNQSEA GSHTLQEMYG CDVGSDGRLR RGYEQYGYDG RDYLALNEDL RSWTAADTAA QISKRKMEAA GAAERFRNYL EGTCVEWLRR YLENGKDTLL RADPPKAHVT RHPSSEHEVT LRCWALGFYP EEISLTWQRN GEDQTQDMEL VETRPSGDGN FQKWAALVVP SGEEQRYTCR VQHEGLQEPL TLRWEPG |
| Secondary structure | CCEEEEEEEE EECCCCCCCC EEEEEEEECC EEEEEEECCC CCCCCEECCC CCCCCCHHHH HHHHHHHHHH HHHHHHHHHH HHHHHCCCCC CCCEEEEEEE EEECCCCCEE EEEEEEEECC EEEEEECCCC CCEEECCHHH HHHHHHHHHH CHHHHHHHHH HCHHHHHHHH HHHHCHHHHH CCCCCEEEEE EEECCCCEEE EEEEEEEECC CCCEEEEEEC CEECCCCCEE CCCEECCCCC EEEEEEEEEE CCCCCCEEEE EECCCCCCCE EECCCCC |
| Movie from predicted structures | To download the movie, right click on the desired file format:  
|
| Estimated finish time | 2018-Oct-15 13:42 UTC |
| Project Name |

| Project Name |
| Cluster # | 1 | 2 | 3 | 4 | 5 | 6 | 7 | 8 | 9 | 10 | 11 | 12 |
| Cluster density | 210.6 | 188.1 | 174.7 | 147.4 | 139.3 | 139.0 | 119.5 | 115.8 | 115.0 | 99.1 | 94.0 | 75.3 |
| Cluster size | 262 | 230 | 214 | 179 | 193 | 169 | 150 | 134 | 139 | 125 | 107 | 98 |
| Average cluster RMSD | 1.2 | 1.2 | 1.2 | 1.2 | 1.4 | 1.2 | 1.3 | 1.2 | 1.2 | 1.3 | 1.1 | 1.3 |
| # | 1 | 2 | 3 | 4 | 5 | 6 | 7 | 8 | 9 | 10 | 11 | 12 |
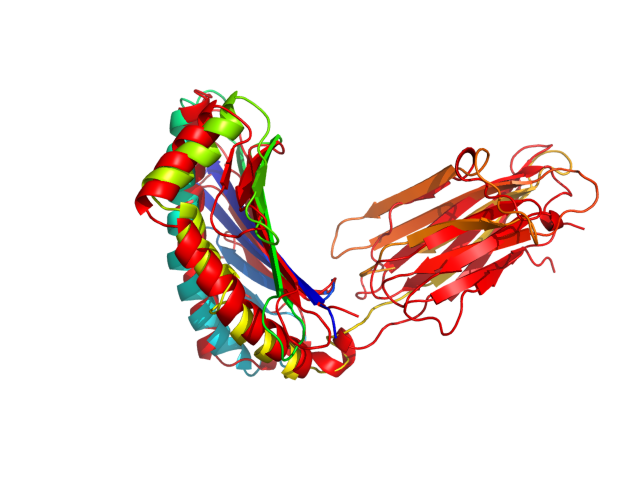
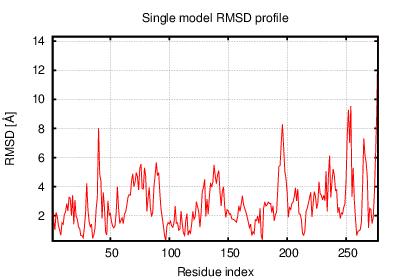
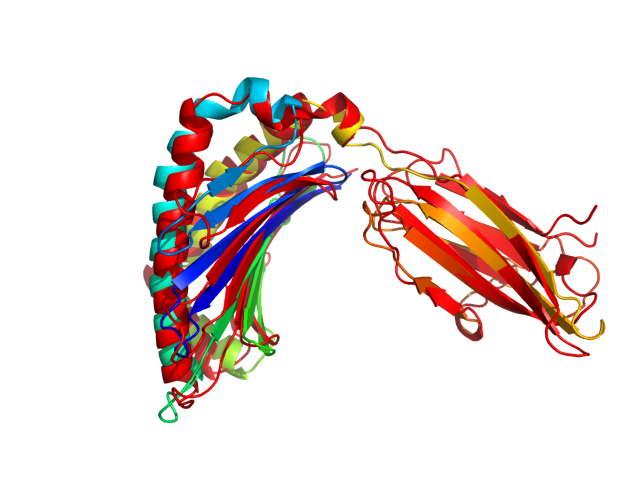
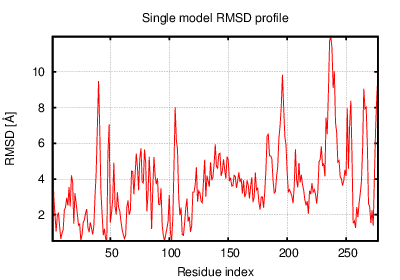
| RMSD | 3.27 | 3.45 | 2.99 | 3.51 | 2.99 | 3.42 | 3.15 | 4.22 | 3.76 | 2.88 | 3.02 | 2.69 |
| GDT_TS | 0.58 | 0.57 | 0.63 | 0.57 | 0.65 | 0.57 | 0.59 | 0.50 | 0.55 | 0.64 | 0.61 | 0.67 |
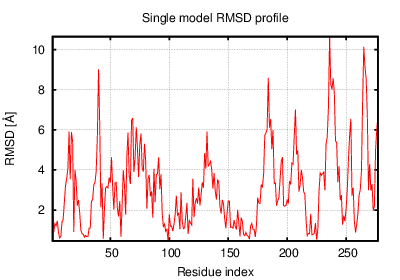
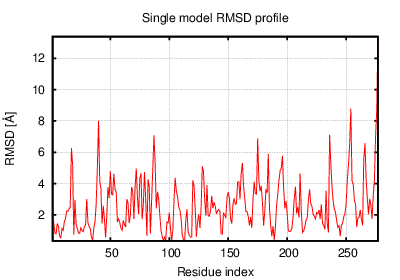
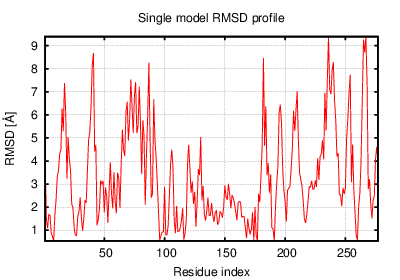
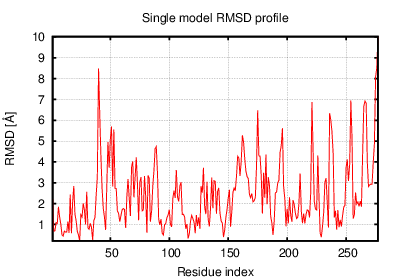
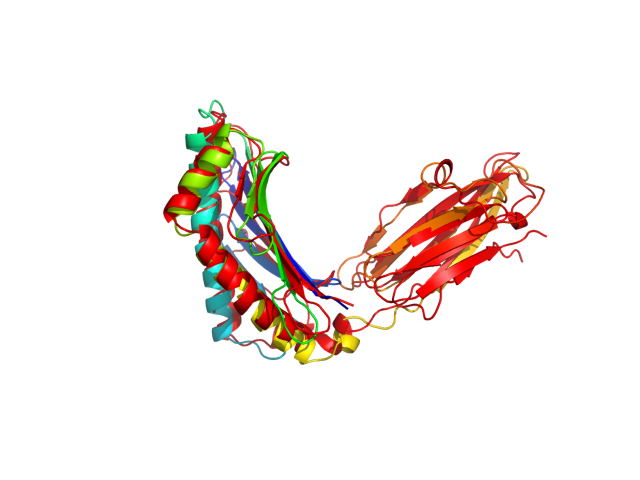
The table contains RMSD and GDT_TS values (calculated on the Cα atoms) between the predicted models and the input structure. Note that GDT_TS metric is intended as a more accurate measurement than the more common RMSD.
Read more about the root-mean-square deviation (RMSD) measure
Read more about the global distance test (GDT, also written as GDT_TS to represent "total score") measure.
| # | 1 | 2 | 3 | 4 | 5 | 6 | 7 | 8 | 9 | 10 | 11 | 12 |
| 1 | 0.00 | 2.18 | 2.44 | 1.93 | 2.55 | 2.13 | 1.91 | 2.82 | 2.23 | 3.16 | 1.91 | 3.19 |
| 2 | 2.18 | 0.00 | 2.74 | 2.00 | 2.95 | 1.80 | 2.25 | 2.58 | 2.02 | 3.45 | 2.15 | 3.52 |
| 3 | 2.44 | 2.74 | 0.00 | 2.47 | 1.84 | 2.66 | 2.22 | 3.39 | 2.83 | 2.35 | 1.99 | 2.68 |
| 4 | 1.93 | 2.00 | 2.47 | 0.00 | 2.67 | 1.98 | 2.25 | 2.76 | 2.42 | 3.43 | 1.91 | 3.45 |
| 5 | 2.55 | 2.95 | 1.84 | 2.67 | 0.00 | 2.84 | 2.29 | 3.45 | 3.08 | 2.44 | 2.10 | 2.85 |
| 6 | 2.13 | 1.80 | 2.66 | 1.98 | 2.84 | 0.00 | 2.30 | 2.43 | 2.08 | 3.43 | 1.86 | 3.40 |
| 7 | 1.91 | 2.25 | 2.22 | 2.25 | 2.29 | 2.30 | 0.00 | 3.01 | 2.43 | 3.02 | 1.89 | 3.04 |
| 8 | 2.82 | 2.58 | 3.39 | 2.76 | 3.45 | 2.43 | 3.01 | 0.00 | 2.62 | 3.87 | 2.94 | 4.09 |
| 9 | 2.23 | 2.02 | 2.83 | 2.42 | 3.08 | 2.08 | 2.43 | 2.62 | 0.00 | 3.70 | 2.46 | 3.67 |
| 10 | 3.16 | 3.45 | 2.35 | 3.43 | 2.44 | 3.43 | 3.02 | 3.87 | 3.70 | 0.00 | 2.92 | 2.30 |
| 11 | 1.91 | 2.15 | 1.99 | 1.91 | 2.10 | 1.86 | 1.89 | 2.94 | 2.46 | 2.92 | 0.00 | 2.93 |
| 12 | 3.19 | 3.52 | 2.68 | 3.45 | 2.85 | 3.40 | 3.04 | 4.09 | 3.67 | 2.30 | 2.93 | 0.00 |
The table contains RMSD values (calculated on the Cα atoms) between the predicted models.
Read more about the root-mean-square deviation (RMSD) measure.
| # | 1 | 2 | 3 | 4 | 5 | 6 | 7 | 8 | 9 | 10 | 11 | 12 |
| 1 | 1.00 | 0.73 | 0.68 | 0.77 | 0.68 | 0.72 | 0.80 | 0.67 | 0.72 | 0.64 | 0.77 | 0.60 |
| 2 | 0.73 | 1.00 | 0.68 | 0.76 | 0.66 | 0.78 | 0.71 | 0.68 | 0.74 | 0.62 | 0.72 | 0.58 |
| 3 | 0.68 | 0.68 | 1.00 | 0.67 | 0.78 | 0.67 | 0.71 | 0.60 | 0.67 | 0.71 | 0.75 | 0.67 |
| 4 | 0.77 | 0.76 | 0.67 | 1.00 | 0.65 | 0.75 | 0.72 | 0.67 | 0.69 | 0.61 | 0.77 | 0.57 |
| 5 | 0.68 | 0.66 | 0.78 | 0.65 | 1.00 | 0.66 | 0.70 | 0.61 | 0.66 | 0.69 | 0.75 | 0.64 |
| 6 | 0.72 | 0.78 | 0.67 | 0.75 | 0.66 | 1.00 | 0.70 | 0.69 | 0.74 | 0.61 | 0.78 | 0.59 |
| 7 | 0.80 | 0.71 | 0.71 | 0.72 | 0.70 | 0.70 | 1.00 | 0.65 | 0.69 | 0.64 | 0.78 | 0.61 |
| 8 | 0.67 | 0.68 | 0.60 | 0.67 | 0.61 | 0.69 | 0.65 | 1.00 | 0.68 | 0.55 | 0.67 | 0.53 |
| 9 | 0.72 | 0.74 | 0.67 | 0.69 | 0.66 | 0.74 | 0.69 | 0.68 | 1.00 | 0.58 | 0.70 | 0.57 |
| 10 | 0.64 | 0.62 | 0.71 | 0.61 | 0.69 | 0.61 | 0.64 | 0.55 | 0.58 | 1.00 | 0.66 | 0.73 |
| 11 | 0.77 | 0.72 | 0.75 | 0.77 | 0.75 | 0.78 | 0.78 | 0.67 | 0.70 | 0.66 | 1.00 | 0.64 |
| 12 | 0.60 | 0.58 | 0.67 | 0.57 | 0.64 | 0.59 | 0.61 | 0.53 | 0.57 | 0.73 | 0.64 | 1.00 |
The table contains GDT_TS values (calculated on the Cα atoms) between the predicted models.
Read more about the global distance test (GDT, also written as GDT_TS to represent "total score") measure.
© Laboratory of Theory of Biopolymers, Faculty of Chemistry, University of Warsaw 2013