Status: Done started: 2018-Apr-26 04:10:29 UTC
| Project Name | p17_raptorX |
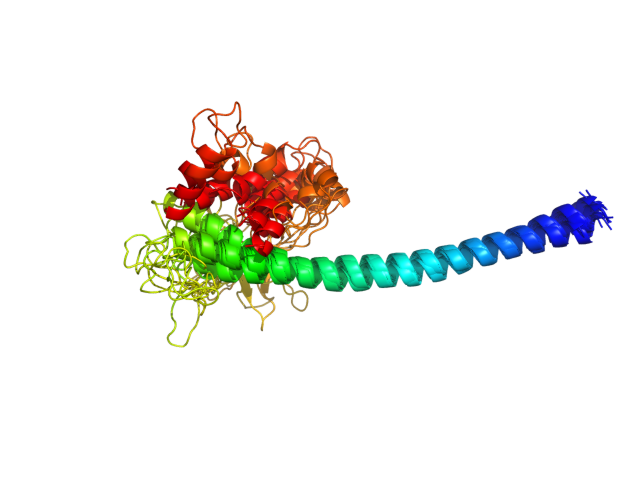
| Sequence | MDTETSPLLS HNLSTREGIK QSTQGLLAHT IARYPGTTAI LLGILILLVI ILIIVAIVYY NRSVDCKSSM PKPPPSYYVQ QPEPHHHFPV FFRKRKNSTS LQSHIPSDEQ LAELAHS |
| Secondary structure | CCCCCHHHHH HHHHHHHHHH HHHHHHHHHH HHHHHHHHHH HHHHHHHHHH HHHHHHHHHC CCCCCCCCCC CCCCCCCCCC CCCCCCCCCC CCCCCHHHHC CCCCCCCHHH HHHHCCC |
| Movie from predicted structures | To download the movie, right click on the desired file format:  
|
| Estimated finish time | 2018-Apr-26 08:44 UTC |
| Project Name | p17_raptorX |


| Project Name | p17_raptorX |
| Cluster # | 1 | 2 | 3 | 4 | 5 | 6 | 7 | 8 | 9 | 10 | 11 | 12 |
| Cluster density | 100.2 | 87.7 | 72.6 | 67.3 | 56.6 | 53.1 | 53.1 | 53.0 | 51.9 | 49.8 | 36.7 | 22.4 |
| Cluster size | 285 | 256 | 184 | 223 | 155 | 137 | 136 | 166 | 144 | 126 | 146 | 42 |
| Average cluster RMSD | 2.8 | 2.9 | 2.5 | 3.3 | 2.7 | 2.6 | 2.6 | 3.1 | 2.8 | 2.5 | 4.0 | 1.9 |
| # | 1 | 2 | 3 | 4 | 5 | 6 | 7 | 8 | 9 | 10 | 11 | 12 |
| RMSD | 7.81 | 6.99 | 8.79 | 7.23 | 6.31 | 8.38 | 4.64 | 5.81 | 6.55 | 9.00 | 6.17 | 7.28 |
| GDT_TS | 0.42 | 0.41 | 0.40 | 0.40 | 0.41 | 0.41 | 0.51 | 0.43 | 0.50 | 0.40 | 0.42 | 0.43 |
The table contains RMSD and GDT_TS values (calculated on the Cα atoms) between the predicted models and the input structure. Note that GDT_TS metric is intended as a more accurate measurement than the more common RMSD.
Read more about the root-mean-square deviation (RMSD) measure
Read more about the global distance test (GDT, also written as GDT_TS to represent "total score") measure.
| # | 1 | 2 | 3 | 4 | 5 | 6 | 7 | 8 | 9 | 10 | 11 | 12 |
| 1 | 0.00 | 6.48 | 10.30 | 8.00 | 8.03 | 10.60 | 6.38 | 6.40 | 3.74 | 11.90 | 6.45 | 11.30 |
| 2 | 6.48 | 0.00 | 7.53 | 4.93 | 6.95 | 9.34 | 6.07 | 3.50 | 6.02 | 10.70 | 3.45 | 10.70 |
| 3 | 10.30 | 7.53 | 0.00 | 5.13 | 7.35 | 6.34 | 7.93 | 7.15 | 9.57 | 7.79 | 6.69 | 8.72 |
| 4 | 8.00 | 4.93 | 5.13 | 0.00 | 6.04 | 8.29 | 5.84 | 4.15 | 6.99 | 9.09 | 3.95 | 9.32 |
| 5 | 8.03 | 6.95 | 7.35 | 6.04 | 0.00 | 7.09 | 5.01 | 5.68 | 6.96 | 7.51 | 6.38 | 6.94 |
| 6 | 10.60 | 9.34 | 6.34 | 8.29 | 7.09 | 0.00 | 8.05 | 8.89 | 10.20 | 4.76 | 8.53 | 5.77 |
| 7 | 6.38 | 6.07 | 7.93 | 5.84 | 5.01 | 8.05 | 0.00 | 4.64 | 5.17 | 9.14 | 5.03 | 7.97 |
| 8 | 6.40 | 3.50 | 7.15 | 4.15 | 5.68 | 8.89 | 4.64 | 0.00 | 5.45 | 10.00 | 3.75 | 9.72 |
| 9 | 3.74 | 6.02 | 9.57 | 6.99 | 6.96 | 10.20 | 5.17 | 5.45 | 0.00 | 11.40 | 5.72 | 10.40 |
| 10 | 11.90 | 10.70 | 7.79 | 9.09 | 7.51 | 4.76 | 9.14 | 10.00 | 11.40 | 0.00 | 10.10 | 4.59 |
| 11 | 6.45 | 3.45 | 6.69 | 3.95 | 6.38 | 8.53 | 5.03 | 3.75 | 5.72 | 10.10 | 0.00 | 9.75 |
| 12 | 11.30 | 10.70 | 8.72 | 9.32 | 6.94 | 5.77 | 7.97 | 9.72 | 10.40 | 4.59 | 9.75 | 0.00 |
The table contains RMSD values (calculated on the Cα atoms) between the predicted models.
Read more about the root-mean-square deviation (RMSD) measure.
| # | 1 | 2 | 3 | 4 | 5 | 6 | 7 | 8 | 9 | 10 | 11 | 12 |
| 1 | 1.00 | 0.47 | 0.48 | 0.48 | 0.53 | 0.51 | 0.51 | 0.55 | 0.61 | 0.49 | 0.48 | 0.45 |
| 2 | 0.47 | 1.00 | 0.48 | 0.59 | 0.46 | 0.45 | 0.53 | 0.68 | 0.58 | 0.53 | 0.63 | 0.48 |
| 3 | 0.48 | 0.48 | 1.00 | 0.61 | 0.46 | 0.53 | 0.52 | 0.50 | 0.48 | 0.47 | 0.59 | 0.48 |
| 4 | 0.48 | 0.59 | 0.61 | 1.00 | 0.49 | 0.45 | 0.58 | 0.61 | 0.51 | 0.50 | 0.69 | 0.49 |
| 5 | 0.53 | 0.46 | 0.46 | 0.49 | 1.00 | 0.53 | 0.55 | 0.57 | 0.48 | 0.52 | 0.46 | 0.48 |
| 6 | 0.51 | 0.45 | 0.53 | 0.45 | 0.53 | 1.00 | 0.50 | 0.48 | 0.46 | 0.54 | 0.46 | 0.49 |
| 7 | 0.51 | 0.53 | 0.52 | 0.58 | 0.55 | 0.50 | 1.00 | 0.64 | 0.60 | 0.56 | 0.59 | 0.54 |
| 8 | 0.55 | 0.68 | 0.50 | 0.61 | 0.57 | 0.48 | 0.64 | 1.00 | 0.57 | 0.56 | 0.61 | 0.49 |
| 9 | 0.61 | 0.58 | 0.48 | 0.51 | 0.48 | 0.46 | 0.60 | 0.57 | 1.00 | 0.50 | 0.56 | 0.51 |
| 10 | 0.49 | 0.53 | 0.47 | 0.50 | 0.52 | 0.54 | 0.56 | 0.56 | 0.50 | 1.00 | 0.50 | 0.63 |
| 11 | 0.48 | 0.63 | 0.59 | 0.69 | 0.46 | 0.46 | 0.59 | 0.61 | 0.56 | 0.50 | 1.00 | 0.53 |
| 12 | 0.45 | 0.48 | 0.48 | 0.49 | 0.48 | 0.49 | 0.54 | 0.49 | 0.51 | 0.63 | 0.53 | 1.00 |
The table contains GDT_TS values (calculated on the Cα atoms) between the predicted models.
Read more about the global distance test (GDT, also written as GDT_TS to represent "total score") measure.
© Laboratory of Theory of Biopolymers, Faculty of Chemistry, University of Warsaw 2013