Status: Done started: 2018-Jun-27 08:07:05 UTC
| Project Name | |
| Sequence | RNLMIVDGTN LGFRFKHNNS KKPFASSYVS TIQSLAKSYS ARTTIVLGDK GKSVFRLEHL PEYKGNRDEK YAQRTEEEKA LDEQFFEYLK DAFELCKTTF PTFTIRGVEA DDMAAYIVKL IGHLYDHVWL ISTDGKWDTL LTDKVSRFSF TTRREYHLRD MYEHHNVDDV EQFISLKAIM GDLGDNIRGV EGIGAKRGYN IIREFGNVLD IIDQLPLPGK QKYIQNLNAS EELLFRNLIL VDLPTYCVDA IAAVGQDVLD KFTKDILEIA EQ |
| Secondary structure | CEEEEEEHHH HHCCCCCCCC CCCCHHHHHH HHHHHHHHCC EEEEEEECCC CCCHHHHHHC CCCCHHHHHH HHCCCHHHHH HHHHHHHHHH HHHHHHHHHC CEECCCCCCH HHHHHHHHHH HCCCCCCEEE ECCCCCCCCC CCCCEEEECC CCCCEECCCC HHHHHCCCCH HHHHHHHHHH EECCCCEECC CCCCHHHHHH HHHHHCCHHH HHHCCCCCCC CHHHHHHHCC HHHHHHHHHH HCHHHHHHHH HHCCCHHHHH HHHHHHHHHH HC |
| Movie from predicted structures | To download the movie, right click on the desired file format:  
|
| Estimated finish time | 2018-Jun-27 13:01 UTC |
| Project Name |


| Project Name |
| Cluster # | 1 | 2 | 3 | 4 | 5 | 6 | 7 | 8 | 9 | 10 | 11 | 12 |
| Cluster density | 172.8 | 170.6 | 160.7 | 155.6 | 153.7 | 151.6 | 138.7 | 135.4 | 131.6 | 113.1 | 81.9 | 79.8 |
| Cluster size | 223 | 218 | 194 | 185 | 190 | 182 | 170 | 173 | 153 | 126 | 98 | 88 |
| Average cluster RMSD | 1.3 | 1.3 | 1.2 | 1.2 | 1.2 | 1.2 | 1.2 | 1.3 | 1.2 | 1.1 | 1.2 | 1.1 |
| # | 1 | 2 | 3 | 4 | 5 | 6 | 7 | 8 | 9 | 10 | 11 | 12 |
| RMSD | 3.15 | 2.85 | 3.17 | 3.22 | 2.78 | 2.65 | 2.74 | 3.49 | 3.16 | 3.09 | 2.87 | 3.15 |
| GDT_TS | 0.63 | 0.64 | 0.64 | 0.61 | 0.68 | 0.68 | 0.65 | 0.60 | 0.64 | 0.64 | 0.67 | 0.65 |
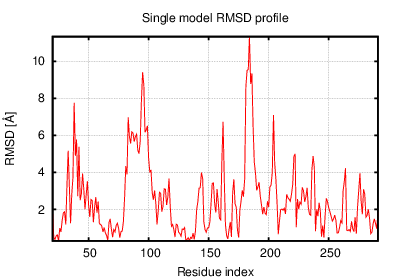
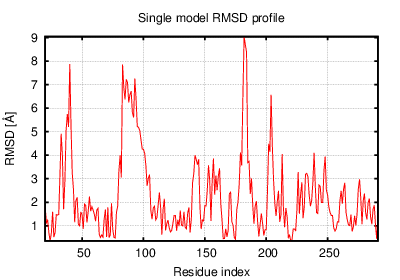
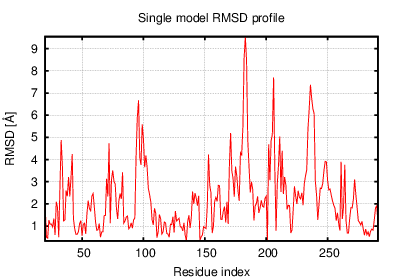
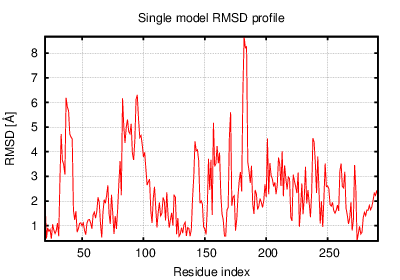
The table contains RMSD and GDT_TS values (calculated on the Cα atoms) between the predicted models and the input structure. Note that GDT_TS metric is intended as a more accurate measurement than the more common RMSD.
Read more about the root-mean-square deviation (RMSD) measure
Read more about the global distance test (GDT, also written as GDT_TS to represent "total score") measure.
| # | 1 | 2 | 3 | 4 | 5 | 6 | 7 | 8 | 9 | 10 | 11 | 12 |
| 1 | 0.00 | 2.58 | 2.61 | 2.03 | 2.42 | 2.62 | 2.41 | 2.26 | 2.19 | 2.58 | 3.17 | 2.03 |
| 2 | 2.58 | 0.00 | 2.51 | 2.49 | 2.34 | 2.31 | 2.05 | 2.79 | 2.56 | 1.90 | 2.76 | 2.59 |
| 3 | 2.61 | 2.51 | 0.00 | 2.08 | 2.11 | 2.94 | 2.31 | 2.09 | 2.01 | 2.13 | 2.93 | 2.36 |
| 4 | 2.03 | 2.49 | 2.08 | 0.00 | 2.20 | 2.76 | 2.22 | 1.72 | 1.89 | 2.29 | 3.07 | 1.92 |
| 5 | 2.42 | 2.34 | 2.11 | 2.20 | 0.00 | 2.43 | 1.76 | 2.37 | 2.06 | 2.37 | 2.47 | 2.09 |
| 6 | 2.62 | 2.31 | 2.94 | 2.76 | 2.43 | 0.00 | 2.35 | 2.83 | 2.66 | 2.59 | 2.53 | 2.92 |
| 7 | 2.41 | 2.05 | 2.31 | 2.22 | 1.76 | 2.35 | 0.00 | 2.50 | 2.21 | 2.18 | 2.44 | 2.30 |
| 8 | 2.26 | 2.79 | 2.09 | 1.72 | 2.37 | 2.83 | 2.50 | 0.00 | 1.77 | 2.55 | 3.21 | 2.05 |
| 9 | 2.19 | 2.56 | 2.01 | 1.89 | 2.06 | 2.66 | 2.21 | 1.77 | 0.00 | 2.46 | 2.90 | 2.16 |
| 10 | 2.58 | 1.90 | 2.13 | 2.29 | 2.37 | 2.59 | 2.18 | 2.55 | 2.46 | 0.00 | 2.88 | 2.63 |
| 11 | 3.17 | 2.76 | 2.93 | 3.07 | 2.47 | 2.53 | 2.44 | 3.21 | 2.90 | 2.88 | 0.00 | 3.01 |
| 12 | 2.03 | 2.59 | 2.36 | 1.92 | 2.09 | 2.92 | 2.30 | 2.05 | 2.16 | 2.63 | 3.01 | 0.00 |
The table contains RMSD values (calculated on the Cα atoms) between the predicted models.
Read more about the root-mean-square deviation (RMSD) measure.
| # | 1 | 2 | 3 | 4 | 5 | 6 | 7 | 8 | 9 | 10 | 11 | 12 |
| 1 | 1.00 | 0.66 | 0.70 | 0.73 | 0.71 | 0.65 | 0.71 | 0.71 | 0.73 | 0.68 | 0.60 | 0.78 |
| 2 | 0.66 | 1.00 | 0.67 | 0.67 | 0.71 | 0.71 | 0.73 | 0.65 | 0.67 | 0.74 | 0.66 | 0.68 |
| 3 | 0.70 | 0.67 | 1.00 | 0.77 | 0.75 | 0.64 | 0.71 | 0.74 | 0.78 | 0.73 | 0.63 | 0.76 |
| 4 | 0.73 | 0.67 | 0.77 | 1.00 | 0.76 | 0.64 | 0.73 | 0.79 | 0.76 | 0.69 | 0.62 | 0.76 |
| 5 | 0.71 | 0.71 | 0.75 | 0.76 | 1.00 | 0.70 | 0.80 | 0.73 | 0.73 | 0.71 | 0.66 | 0.77 |
| 6 | 0.65 | 0.71 | 0.64 | 0.64 | 0.70 | 1.00 | 0.70 | 0.62 | 0.65 | 0.66 | 0.70 | 0.65 |
| 7 | 0.71 | 0.73 | 0.71 | 0.73 | 0.80 | 0.70 | 1.00 | 0.69 | 0.71 | 0.71 | 0.66 | 0.73 |
| 8 | 0.71 | 0.65 | 0.74 | 0.79 | 0.73 | 0.62 | 0.69 | 1.00 | 0.77 | 0.66 | 0.60 | 0.76 |
| 9 | 0.73 | 0.67 | 0.78 | 0.76 | 0.73 | 0.65 | 0.71 | 0.77 | 1.00 | 0.69 | 0.63 | 0.75 |
| 10 | 0.68 | 0.74 | 0.73 | 0.69 | 0.71 | 0.66 | 0.71 | 0.66 | 0.69 | 1.00 | 0.66 | 0.69 |
| 11 | 0.60 | 0.66 | 0.63 | 0.62 | 0.66 | 0.70 | 0.66 | 0.60 | 0.63 | 0.66 | 1.00 | 0.63 |
| 12 | 0.78 | 0.68 | 0.76 | 0.76 | 0.77 | 0.65 | 0.73 | 0.76 | 0.75 | 0.69 | 0.63 | 1.00 |
The table contains GDT_TS values (calculated on the Cα atoms) between the predicted models.
Read more about the global distance test (GDT, also written as GDT_TS to represent "total score") measure.
© Laboratory of Theory of Biopolymers, Faculty of Chemistry, University of Warsaw 2013