Status: Done started: 2018-May-25 07:46:58 UTC
| Project Name | |
| Sequence | MAQIWLWIGV IGMALGSIFF GIGAHNAKNE RWKILFTINF FICAIATGLY LSMALGQGRS VIAGRPTVWV RYITWFLSTP LLILDLTFLG KTSLPITASL LGANAYMIAT GFVATISADR TIGHIWYVVS CFAFLATVYL LVNQYRKQAE RNYPQAKKVF RKLLSVHLVL WTLYPIVWLL GNTGFNAVNQ GTETMFYTIL DITSKVGFGF LSLNSMHTLE |
| Secondary structure | CHHHHHHHHH HHHHHHHHHH HHHHCCCCCH HHHHHHHHHH HHHHHHHHHH HHHHCCCCEE EECCEEEECH HHHHHHHHHH HHHHHHHHHH CCCHHHHHHH HHHHHHHHHH HHHHHHCCCC CHHHHHHHHH HHHHHHHHHH HHCHHHHHHH HHCCCCHHHH HHHHHHHHHH HHHHHHHHHH CCCCCCCCCH HHHHHHHHHH HHHHHHHHHH HHHHHHHHHC |
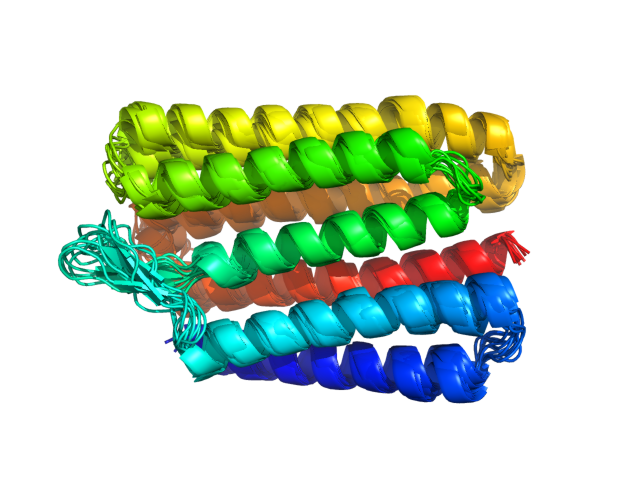
| Movie from predicted structures | To download the movie, right click on the desired file format:  
|
| Estimated finish time | 2018-May-25 12:34 UTC |
| Project Name |


| Project Name |
| Cluster # | 1 | 2 | 3 | 4 | 5 | 6 | 7 | 8 | 9 | 10 | 11 | 12 |
| Cluster density | 302.9 | 246.8 | 241.9 | 214.4 | 193.2 | 190.0 | 177.8 | 164.9 | 161.3 | 145.1 | 111.4 | 92.9 |
| Cluster size | 262 | 229 | 212 | 184 | 170 | 158 | 182 | 178 | 139 | 123 | 97 | 66 |
| Average cluster RMSD | 0.9 | 0.9 | 0.9 | 0.9 | 0.9 | 0.8 | 1.0 | 1.1 | 0.9 | 0.8 | 0.9 | 0.7 |
| # | 1 | 2 | 3 | 4 | 5 | 6 | 7 | 8 | 9 | 10 | 11 | 12 |
| RMSD | 2.20 | 1.98 | 2.32 | 2.27 | 2.35 | 2.30 | 2.48 | 2.10 | 2.23 | 2.08 | 2.17 | 2.04 |
| GDT_TS | 0.73 | 0.77 | 0.74 | 0.73 | 0.69 | 0.71 | 0.72 | 0.75 | 0.75 | 0.75 | 0.75 | 0.76 |
The table contains RMSD and GDT_TS values (calculated on the Cα atoms) between the predicted models and the input structure. Note that GDT_TS metric is intended as a more accurate measurement than the more common RMSD.
Read more about the root-mean-square deviation (RMSD) measure
Read more about the global distance test (GDT, also written as GDT_TS to represent "total score") measure.
| # | 1 | 2 | 3 | 4 | 5 | 6 | 7 | 8 | 9 | 10 | 11 | 12 |
| 1 | 0.00 | 1.30 | 1.84 | 1.48 | 1.70 | 1.50 | 2.08 | 2.01 | 1.77 | 1.61 | 1.81 | 1.59 |
| 2 | 1.30 | 0.00 | 1.91 | 1.82 | 1.71 | 1.69 | 2.31 | 2.11 | 1.54 | 1.46 | 1.45 | 1.60 |
| 3 | 1.84 | 1.91 | 0.00 | 1.80 | 1.85 | 1.87 | 1.53 | 1.47 | 2.16 | 2.22 | 2.31 | 2.05 |
| 4 | 1.48 | 1.82 | 1.80 | 0.00 | 1.57 | 1.47 | 1.90 | 1.94 | 2.26 | 2.17 | 2.20 | 1.88 |
| 5 | 1.70 | 1.71 | 1.85 | 1.57 | 0.00 | 1.88 | 2.16 | 1.94 | 2.32 | 2.26 | 2.03 | 1.78 |
| 6 | 1.50 | 1.69 | 1.87 | 1.47 | 1.88 | 0.00 | 1.78 | 1.85 | 2.07 | 2.01 | 2.06 | 1.76 |
| 7 | 2.08 | 2.31 | 1.53 | 1.90 | 2.16 | 1.78 | 0.00 | 1.49 | 2.35 | 2.42 | 2.65 | 1.98 |
| 8 | 2.01 | 2.11 | 1.47 | 1.94 | 1.94 | 1.85 | 1.49 | 0.00 | 2.20 | 2.26 | 2.42 | 1.88 |
| 9 | 1.77 | 1.54 | 2.16 | 2.26 | 2.32 | 2.07 | 2.35 | 2.20 | 0.00 | 1.07 | 1.56 | 1.72 |
| 10 | 1.61 | 1.46 | 2.22 | 2.17 | 2.26 | 2.01 | 2.42 | 2.26 | 1.07 | 0.00 | 1.62 | 1.57 |
| 11 | 1.81 | 1.45 | 2.31 | 2.20 | 2.03 | 2.06 | 2.65 | 2.42 | 1.56 | 1.62 | 0.00 | 1.79 |
| 12 | 1.59 | 1.60 | 2.05 | 1.88 | 1.78 | 1.76 | 1.98 | 1.88 | 1.72 | 1.57 | 1.79 | 0.00 |
The table contains RMSD values (calculated on the Cα atoms) between the predicted models.
Read more about the root-mean-square deviation (RMSD) measure.
| # | 1 | 2 | 3 | 4 | 5 | 6 | 7 | 8 | 9 | 10 | 11 | 12 |
| 1 | 1.00 | 0.87 | 0.79 | 0.83 | 0.79 | 0.86 | 0.80 | 0.77 | 0.82 | 0.83 | 0.84 | 0.84 |
| 2 | 0.87 | 1.00 | 0.80 | 0.78 | 0.79 | 0.83 | 0.76 | 0.78 | 0.88 | 0.87 | 0.89 | 0.84 |
| 3 | 0.79 | 0.80 | 1.00 | 0.79 | 0.79 | 0.80 | 0.86 | 0.86 | 0.77 | 0.76 | 0.79 | 0.79 |
| 4 | 0.83 | 0.78 | 0.79 | 1.00 | 0.85 | 0.84 | 0.81 | 0.80 | 0.72 | 0.73 | 0.76 | 0.81 |
| 5 | 0.79 | 0.79 | 0.79 | 0.85 | 1.00 | 0.80 | 0.78 | 0.77 | 0.71 | 0.70 | 0.76 | 0.79 |
| 6 | 0.86 | 0.83 | 0.80 | 0.84 | 0.80 | 1.00 | 0.82 | 0.79 | 0.79 | 0.78 | 0.80 | 0.83 |
| 7 | 0.80 | 0.76 | 0.86 | 0.81 | 0.78 | 0.82 | 1.00 | 0.84 | 0.74 | 0.73 | 0.75 | 0.82 |
| 8 | 0.77 | 0.78 | 0.86 | 0.80 | 0.77 | 0.79 | 0.84 | 1.00 | 0.74 | 0.72 | 0.76 | 0.78 |
| 9 | 0.82 | 0.88 | 0.77 | 0.72 | 0.71 | 0.79 | 0.74 | 0.74 | 1.00 | 0.93 | 0.86 | 0.82 |
| 10 | 0.83 | 0.87 | 0.76 | 0.73 | 0.70 | 0.78 | 0.73 | 0.72 | 0.93 | 1.00 | 0.84 | 0.82 |
| 11 | 0.84 | 0.89 | 0.79 | 0.76 | 0.76 | 0.80 | 0.75 | 0.76 | 0.86 | 0.84 | 1.00 | 0.85 |
| 12 | 0.84 | 0.84 | 0.79 | 0.81 | 0.79 | 0.83 | 0.82 | 0.78 | 0.82 | 0.82 | 0.85 | 1.00 |
The table contains GDT_TS values (calculated on the Cα atoms) between the predicted models.
Read more about the global distance test (GDT, also written as GDT_TS to represent "total score") measure.
© Laboratory of Theory of Biopolymers, Faculty of Chemistry, University of Warsaw 2013