Status: Done started: 2018-Jun-25 06:58:17 UTC
| Project Name | |
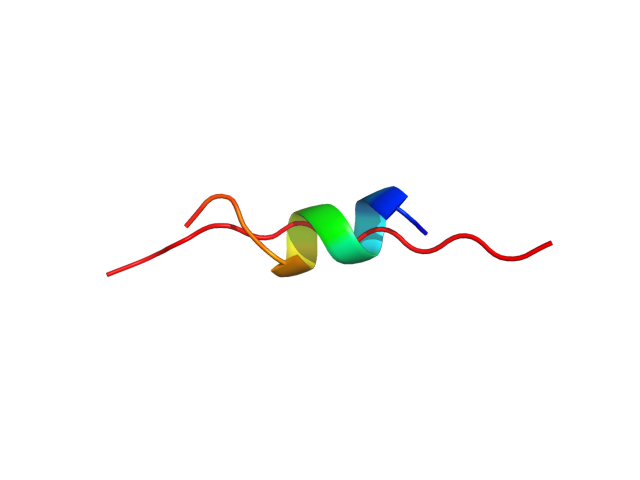
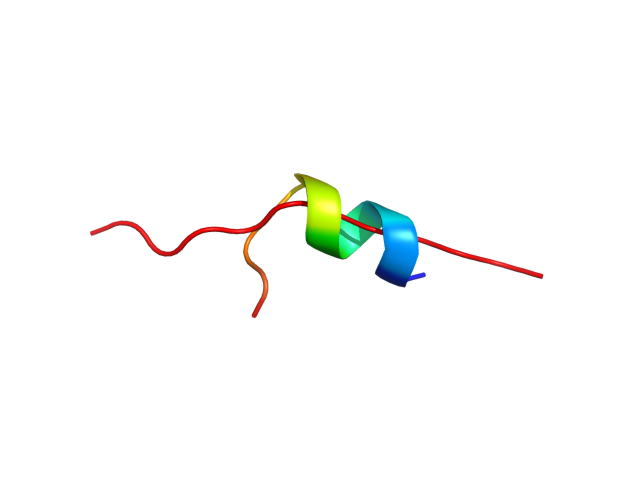
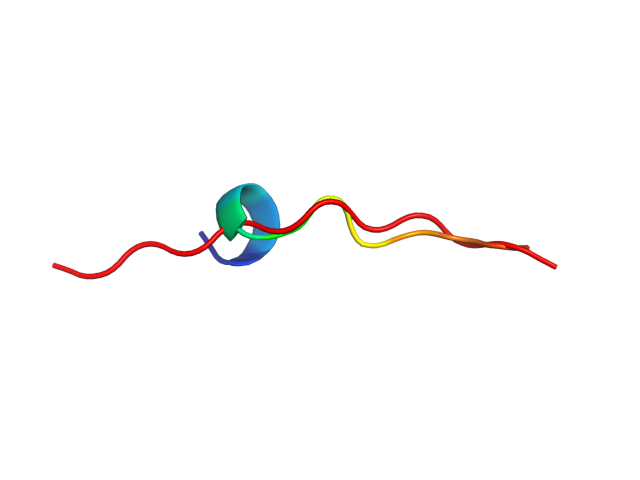
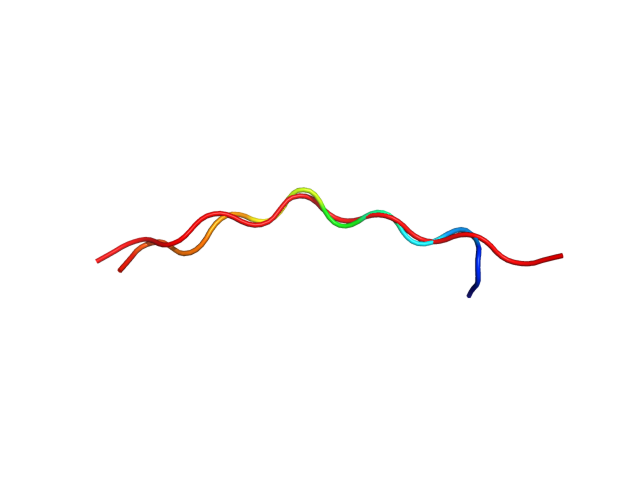
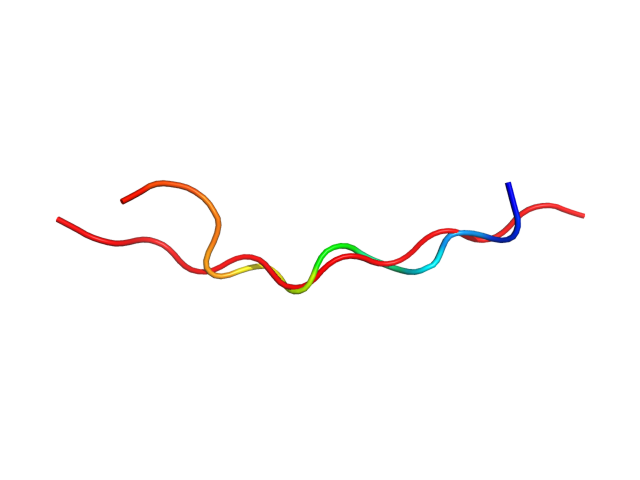
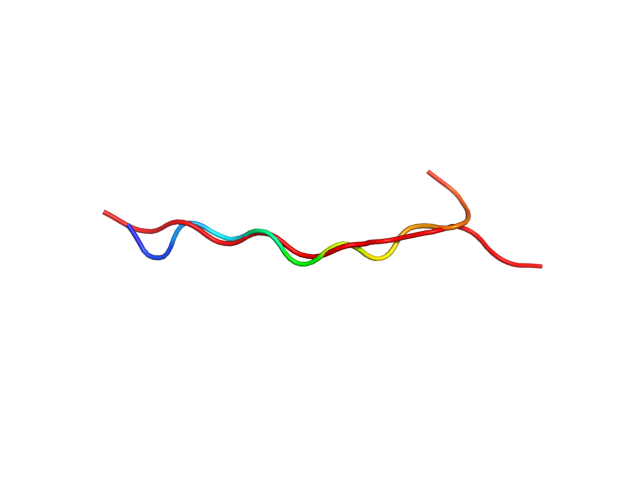
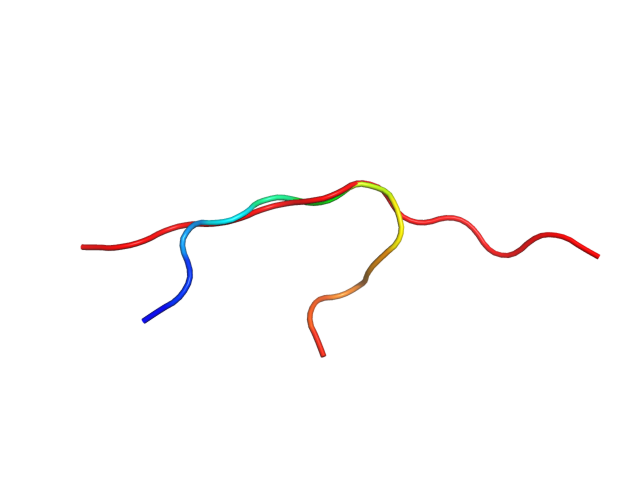
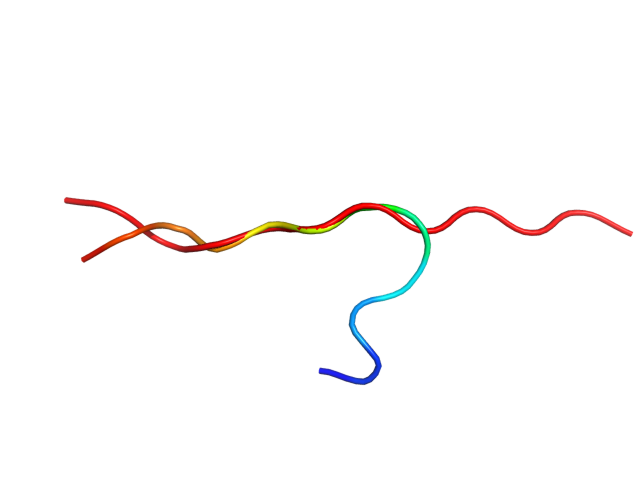
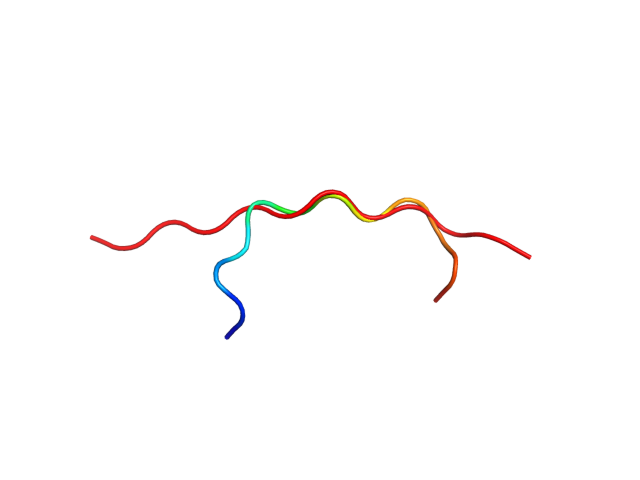
| Sequence | TCSKKYPRSP CM |
| Secondary structure | CCCCCCCCCC CC |
| Movie from predicted structures | To download the movie, right click on the desired file format:  
|
| Estimated finish time | 2018-Jun-25 11:18 UTC |
| Project Name |

| Project Name |
| Cluster # | 1 | 2 | 3 | 4 | 5 | 6 | 7 | 8 | 9 | 10 | 11 | 12 |
| Cluster density | 127.4 | 112.8 | 83.1 | 79.3 | 75.2 | 74.7 | 66.9 | 58.7 | 56.1 | 55.5 | 55.3 | 52.5 |
| Cluster size | 286 | 287 | 148 | 177 | 149 | 170 | 135 | 130 | 117 | 134 | 130 | 137 |
| Average cluster RMSD | 2.2 | 2.5 | 1.8 | 2.2 | 2.0 | 2.3 | 2.0 | 2.2 | 2.1 | 2.4 | 2.4 | 2.6 |
| # | 1 | 2 | 3 | 4 | 5 | 6 | 7 | 8 | 9 | 10 | 11 | 12 |
| RMSD | 6.31 | 7.22 | 1.70 | 4.40 | 2.72 | 3.40 | 3.27 | 4.82 | 4.00 | 7.46 | 6.31 | 5.35 |
| GDT_TS | 0.44 | 0.46 | 0.81 | 0.69 | 0.83 | 0.69 | 0.75 | 0.67 | 0.77 | 0.58 | 0.62 | 0.62 |
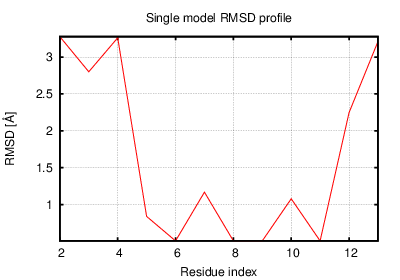
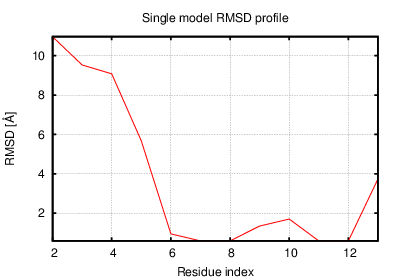
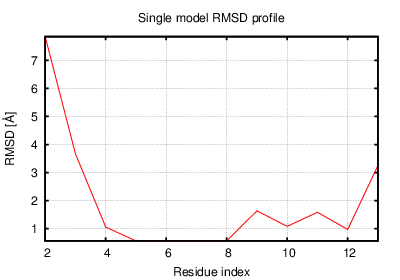
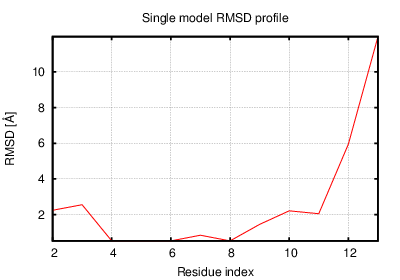
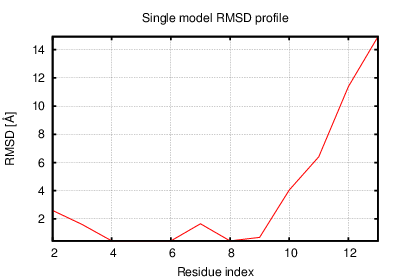
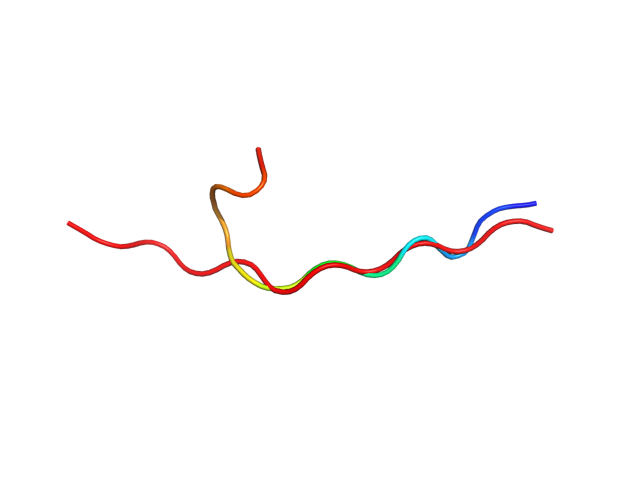
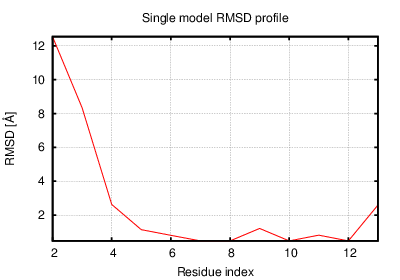
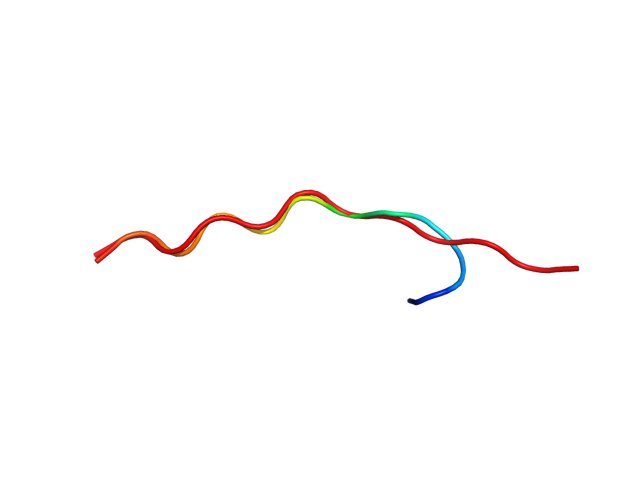
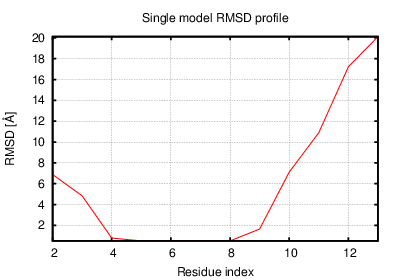
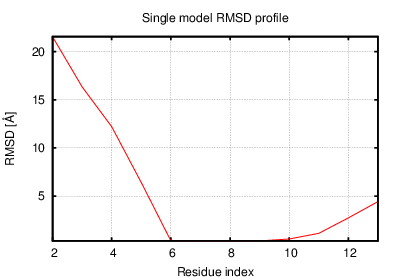
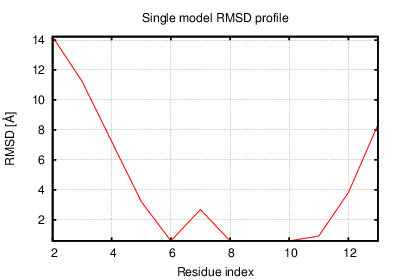
The table contains RMSD and GDT_TS values (calculated on the Cα atoms) between the predicted models and the input structure. Note that GDT_TS metric is intended as a more accurate measurement than the more common RMSD.
Read more about the root-mean-square deviation (RMSD) measure
Read more about the global distance test (GDT, also written as GDT_TS to represent "total score") measure.
| # | 1 | 2 | 3 | 4 | 5 | 6 | 7 | 8 | 9 | 10 | 11 | 12 |
| 1 | 0.00 | 2.91 | 5.48 | 3.50 | 4.85 | 4.20 | 4.99 | 4.99 | 4.63 | 4.96 | 4.06 | 4.52 |
| 2 | 2.91 | 0.00 | 6.34 | 4.32 | 5.37 | 4.74 | 5.22 | 4.20 | 5.11 | 3.44 | 4.18 | 3.85 |
| 3 | 5.48 | 6.34 | 0.00 | 3.82 | 2.38 | 2.74 | 2.85 | 4.08 | 3.52 | 6.55 | 5.58 | 4.27 |
| 4 | 3.50 | 4.32 | 3.82 | 0.00 | 3.10 | 3.26 | 3.53 | 4.28 | 2.80 | 5.35 | 2.95 | 3.24 |
| 5 | 4.85 | 5.37 | 2.38 | 3.10 | 0.00 | 2.42 | 2.80 | 3.73 | 1.87 | 5.84 | 4.33 | 3.67 |
| 6 | 4.20 | 4.74 | 2.74 | 3.26 | 2.42 | 0.00 | 2.85 | 3.28 | 2.99 | 4.97 | 4.29 | 3.35 |
| 7 | 4.99 | 5.22 | 2.85 | 3.53 | 2.80 | 2.85 | 0.00 | 3.03 | 3.72 | 5.36 | 4.93 | 3.49 |
| 8 | 4.99 | 4.20 | 4.08 | 4.28 | 3.73 | 3.28 | 3.03 | 0.00 | 4.42 | 3.54 | 4.73 | 2.88 |
| 9 | 4.63 | 5.11 | 3.52 | 2.80 | 1.87 | 2.99 | 3.72 | 4.42 | 0.00 | 5.65 | 3.45 | 3.43 |
| 10 | 4.96 | 3.44 | 6.55 | 5.35 | 5.84 | 4.97 | 5.36 | 3.54 | 5.65 | 0.00 | 4.45 | 3.70 |
| 11 | 4.06 | 4.18 | 5.58 | 2.95 | 4.33 | 4.29 | 4.93 | 4.73 | 3.45 | 4.45 | 0.00 | 3.34 |
| 12 | 4.52 | 3.85 | 4.27 | 3.24 | 3.67 | 3.35 | 3.49 | 2.88 | 3.43 | 3.70 | 3.34 | 0.00 |
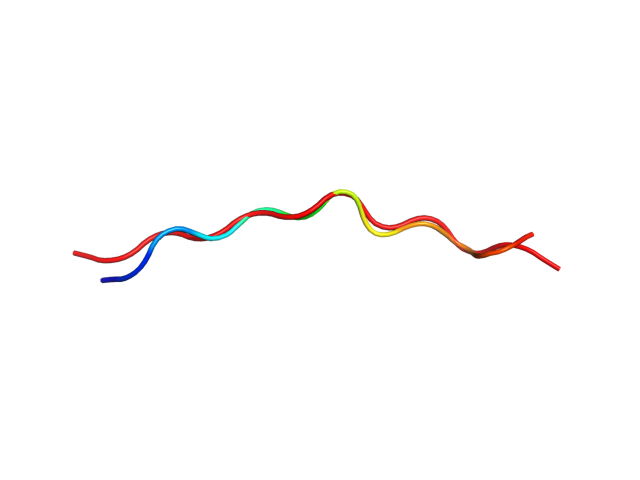
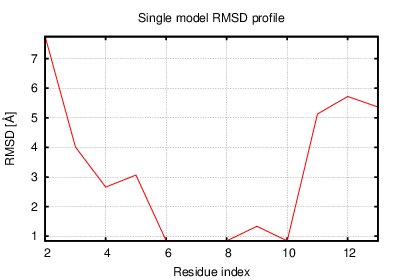
The table contains RMSD values (calculated on the Cα atoms) between the predicted models.
Read more about the root-mean-square deviation (RMSD) measure.
| # | 1 | 2 | 3 | 4 | 5 | 6 | 7 | 8 | 9 | 10 | 11 | 12 |
| 1 | 1.00 | 0.83 | 0.46 | 0.69 | 0.54 | 0.52 | 0.46 | 0.54 | 0.54 | 0.52 | 0.54 | 0.50 |
| 2 | 0.83 | 1.00 | 0.46 | 0.67 | 0.54 | 0.46 | 0.52 | 0.56 | 0.58 | 0.65 | 0.54 | 0.54 |
| 3 | 0.46 | 0.46 | 1.00 | 0.69 | 0.77 | 0.71 | 0.73 | 0.67 | 0.73 | 0.60 | 0.69 | 0.65 |
| 4 | 0.69 | 0.67 | 0.69 | 1.00 | 0.75 | 0.56 | 0.62 | 0.52 | 0.77 | 0.50 | 0.75 | 0.65 |
| 5 | 0.54 | 0.54 | 0.77 | 0.75 | 1.00 | 0.71 | 0.67 | 0.71 | 0.81 | 0.65 | 0.71 | 0.65 |
| 6 | 0.52 | 0.46 | 0.71 | 0.56 | 0.71 | 1.00 | 0.67 | 0.69 | 0.65 | 0.54 | 0.54 | 0.67 |
| 7 | 0.46 | 0.52 | 0.73 | 0.62 | 0.67 | 0.67 | 1.00 | 0.73 | 0.62 | 0.56 | 0.60 | 0.60 |
| 8 | 0.54 | 0.56 | 0.67 | 0.52 | 0.71 | 0.69 | 0.73 | 1.00 | 0.58 | 0.65 | 0.52 | 0.65 |
| 9 | 0.54 | 0.58 | 0.73 | 0.77 | 0.81 | 0.65 | 0.62 | 0.58 | 1.00 | 0.58 | 0.71 | 0.65 |
| 10 | 0.52 | 0.65 | 0.60 | 0.50 | 0.65 | 0.54 | 0.56 | 0.65 | 0.58 | 1.00 | 0.52 | 0.58 |
| 11 | 0.54 | 0.54 | 0.69 | 0.75 | 0.71 | 0.54 | 0.60 | 0.52 | 0.71 | 0.52 | 1.00 | 0.65 |
| 12 | 0.50 | 0.54 | 0.65 | 0.65 | 0.65 | 0.67 | 0.60 | 0.65 | 0.65 | 0.58 | 0.65 | 1.00 |
The table contains GDT_TS values (calculated on the Cα atoms) between the predicted models.
Read more about the global distance test (GDT, also written as GDT_TS to represent "total score") measure.
© Laboratory of Theory of Biopolymers, Faculty of Chemistry, University of Warsaw 2013