Status: Done started: 2018-Jul-20 11:22:59 UTC
| Project Name | |
| Sequence | DMSAEDFDAI IAAHFKPGDT VLETDIASFD KSQDDSLALT ALMLLEDLGV DHSLLDLIEA AFGEISSCHL PTGTRFKFGA MMKSGMFLTL FVNTLLNITI ASRVLEDRLT KSACAAFIGD DNIIHGVVSD ELMAARCATW MNMEVKIIDA VVSLKAPYFC GGFILHDTVT GTACRVADPL KRLFKLGKPL AAGDEQDEDR RRALADEVIR WQRTGLIDEL EKAVYS |
| Secondary structure | CCCCCCHHHH HHHCCCCCCE EEEEECCCHH HHCCCCCCHH HHHHCCCCCC CCHHHHHHHH HCCCCCCCCC CCCCCCCCCC CCCCCCCCHH HHHHHHHHHH HHHHCCCCCC CCEEEEEECC EEEEEECCCC CCHHHHHHHH CCCCCEECCC CCCCCCCCCC CEEEEECCCC CCEEEEECHH HHHHHHHCCC CCCCCCHHHH HHHHHHHHCC CCCHHHHHHH HHHHHC |
| Movie from predicted structures | To download the movie, right click on the desired file format:  
|
| Estimated finish time | 2018-Jul-20 16:11 UTC |
| Project Name |
| Project Name |
| Cluster # | 1 | 2 | 3 | 4 | 5 | 6 | 7 | 8 | 9 | 10 | 11 | 12 |
| Cluster density | 163.7 | 159.7 | 118.0 | 109.8 | 108.9 | 106.0 | 95.0 | 83.8 | 77.2 | 74.9 | 70.6 | 63.7 |
| Cluster size | 274 | 266 | 197 | 180 | 202 | 174 | 151 | 117 | 138 | 112 | 100 | 89 |
| Average cluster RMSD | 1.7 | 1.7 | 1.7 | 1.6 | 1.9 | 1.6 | 1.6 | 1.4 | 1.8 | 1.5 | 1.4 | 1.4 |
| # | 1 | 2 | 3 | 4 | 5 | 6 | 7 | 8 | 9 | 10 | 11 | 12 |
| RMSD | 6.17 | 4.86 | 5.54 | 5.39 | 5.65 | 4.70 | 5.12 | 4.62 | 5.70 | 5.16 | 5.82 | 5.12 |
| GDT_TS | 0.43 | 0.48 | 0.44 | 0.49 | 0.47 | 0.48 | 0.47 | 0.51 | 0.51 | 0.50 | 0.45 | 0.49 |
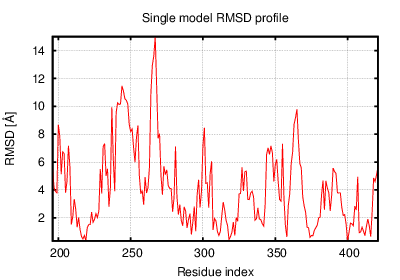
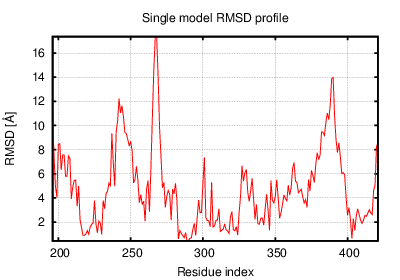
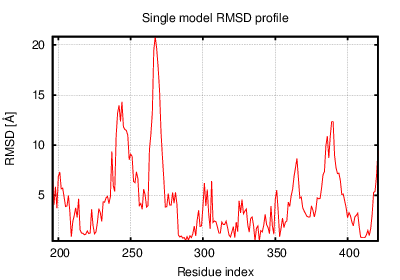
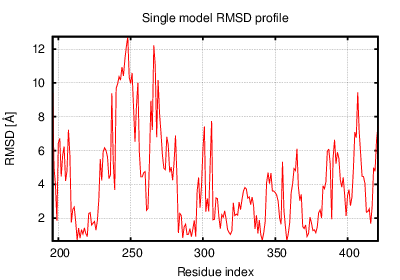
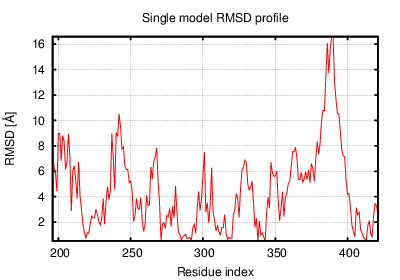
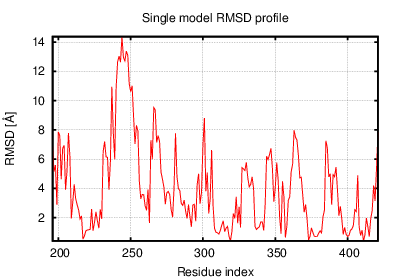
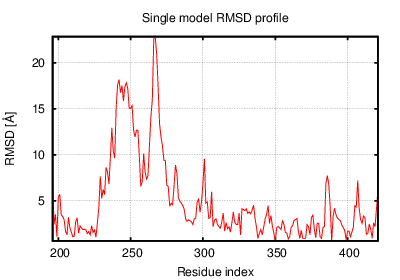
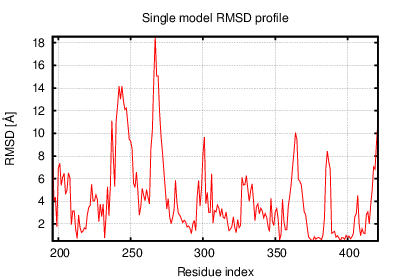
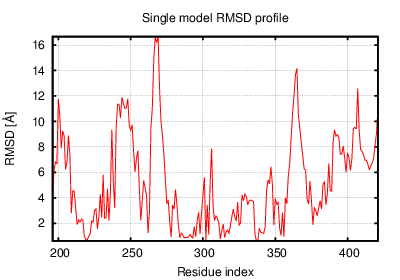
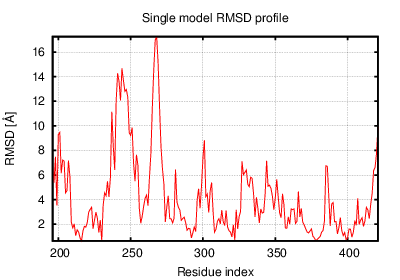
The table contains RMSD and GDT_TS values (calculated on the Cα atoms) between the predicted models and the input structure. Note that GDT_TS metric is intended as a more accurate measurement than the more common RMSD.
Read more about the root-mean-square deviation (RMSD) measure
Read more about the global distance test (GDT, also written as GDT_TS to represent "total score") measure.
| # | 1 | 2 | 3 | 4 | 5 | 6 | 7 | 8 | 9 | 10 | 11 | 12 |
| 1 | 0.00 | 3.81 | 6.40 | 5.10 | 2.05 | 3.18 | 6.62 | 4.05 | 2.66 | 4.47 | 2.31 | 4.53 |
| 2 | 3.81 | 0.00 | 4.41 | 3.50 | 3.76 | 2.78 | 4.74 | 2.11 | 3.47 | 3.04 | 3.67 | 2.62 |
| 3 | 6.40 | 4.41 | 0.00 | 3.37 | 6.13 | 5.34 | 2.80 | 4.06 | 5.72 | 3.81 | 6.18 | 3.79 |
| 4 | 5.10 | 3.50 | 3.37 | 0.00 | 4.81 | 4.37 | 4.04 | 3.30 | 4.29 | 2.63 | 4.83 | 2.64 |
| 5 | 2.05 | 3.76 | 6.13 | 4.81 | 0.00 | 3.04 | 6.38 | 3.97 | 2.61 | 4.13 | 2.32 | 4.29 |
| 6 | 3.18 | 2.78 | 5.34 | 4.37 | 3.04 | 0.00 | 5.41 | 2.92 | 2.76 | 3.52 | 2.70 | 3.57 |
| 7 | 6.62 | 4.74 | 2.80 | 4.04 | 6.38 | 5.41 | 0.00 | 4.22 | 6.20 | 4.40 | 6.36 | 4.40 |
| 8 | 4.05 | 2.11 | 4.06 | 3.30 | 3.97 | 2.92 | 4.22 | 0.00 | 3.60 | 2.60 | 3.75 | 2.23 |
| 9 | 2.66 | 3.47 | 5.72 | 4.29 | 2.61 | 2.76 | 6.20 | 3.60 | 0.00 | 3.65 | 2.46 | 3.63 |
| 10 | 4.47 | 3.04 | 3.81 | 2.63 | 4.13 | 3.52 | 4.40 | 2.60 | 3.65 | 0.00 | 4.01 | 2.31 |
| 11 | 2.31 | 3.67 | 6.18 | 4.83 | 2.32 | 2.70 | 6.36 | 3.75 | 2.46 | 4.01 | 0.00 | 4.23 |
| 12 | 4.53 | 2.62 | 3.79 | 2.64 | 4.29 | 3.57 | 4.40 | 2.23 | 3.63 | 2.31 | 4.23 | 0.00 |
The table contains RMSD values (calculated on the Cα atoms) between the predicted models.
Read more about the root-mean-square deviation (RMSD) measure.
| # | 1 | 2 | 3 | 4 | 5 | 6 | 7 | 8 | 9 | 10 | 11 | 12 |
| 1 | 1.00 | 0.61 | 0.50 | 0.55 | 0.71 | 0.63 | 0.53 | 0.57 | 0.68 | 0.55 | 0.73 | 0.56 |
| 2 | 0.61 | 1.00 | 0.55 | 0.62 | 0.62 | 0.67 | 0.55 | 0.75 | 0.61 | 0.60 | 0.60 | 0.68 |
| 3 | 0.50 | 0.55 | 1.00 | 0.63 | 0.51 | 0.53 | 0.71 | 0.53 | 0.53 | 0.56 | 0.47 | 0.57 |
| 4 | 0.55 | 0.62 | 0.63 | 1.00 | 0.59 | 0.57 | 0.60 | 0.61 | 0.61 | 0.71 | 0.53 | 0.67 |
| 5 | 0.71 | 0.62 | 0.51 | 0.59 | 1.00 | 0.65 | 0.53 | 0.58 | 0.65 | 0.57 | 0.72 | 0.56 |
| 6 | 0.63 | 0.67 | 0.53 | 0.57 | 0.65 | 1.00 | 0.57 | 0.65 | 0.69 | 0.59 | 0.65 | 0.60 |
| 7 | 0.53 | 0.55 | 0.71 | 0.60 | 0.53 | 0.57 | 1.00 | 0.56 | 0.53 | 0.59 | 0.51 | 0.56 |
| 8 | 0.57 | 0.75 | 0.53 | 0.61 | 0.58 | 0.65 | 0.56 | 1.00 | 0.60 | 0.68 | 0.58 | 0.73 |
| 9 | 0.68 | 0.61 | 0.53 | 0.61 | 0.65 | 0.69 | 0.53 | 0.60 | 1.00 | 0.62 | 0.70 | 0.59 |
| 10 | 0.55 | 0.60 | 0.56 | 0.71 | 0.57 | 0.59 | 0.59 | 0.68 | 0.62 | 1.00 | 0.59 | 0.71 |
| 11 | 0.73 | 0.60 | 0.47 | 0.53 | 0.72 | 0.65 | 0.51 | 0.58 | 0.70 | 0.59 | 1.00 | 0.56 |
| 12 | 0.56 | 0.68 | 0.57 | 0.67 | 0.56 | 0.60 | 0.56 | 0.73 | 0.59 | 0.71 | 0.56 | 1.00 |
The table contains GDT_TS values (calculated on the Cα atoms) between the predicted models.
Read more about the global distance test (GDT, also written as GDT_TS to represent "total score") measure.
© Laboratory of Theory of Biopolymers, Faculty of Chemistry, University of Warsaw 2013