Status: Done started: 2018-Jun-11 02:55:50 UTC
| Project Name | |
| Sequence | NIIIWSTLNQ TVFLNNIFTI NDTYGGLFWN TYYDNNRSNF TYCGIAGNYC SCCGHNISLY NTTNNCSLII FPNNTEIFNR TYELVYLDKK INYTVKLLKS VDSPTITYNC TNSLITCKNN NGTNVNIYLI INNTIVNDTN GDILNYYWNG NNNFTATCMI NNTISSLNET ENINCTNPIL KYQNYLSTLF YIIIFIVSGL IIGIFISIIS VLSIRRKRKK HVEEIESPPP SESNEEDISH DDTTSIHEPS PREPLLPKPY SRYQYNTPIY YMRPSTQPLN PFPLPKPCPP PKPCPPPKPC PPPKPCPPPK PCSPPKPCRP PKPCPPPKPC PPPKPCPPPK PCPPSKPCPS PESYSPPKPL PSIPLLPNIP PLSTQNISLI HVDRII |
| Secondary structure | CCCCEEECCC CEEECCCCCC CCCCCEECCC CCCCCCCCCC CEECCCCCCC CCCCCCCCCC CCCCCCCEEE CCCCCCCCCC CCCCCCCCCC CCCCCEEECC CCCCEEEEEC CCCEEEEECC CCCCCEEEEE ECCEEEEEEC CCEEEECCCC CCCCCEEEEE EECCEEEEEE ECCCCCCCCH HHHHHHHHHH HHHHHHHHHH HHHHHHHHCC CCCCCCCCCC CCCCCCCCCC CCCCCCCCCC CCCCCCCCCC CCCCCCCCCC CCCCCCCCCC CCCCCCCCCC CCCCCCCCCC CCCCCCCCCC CCCCCCCCCC CCCCCCCCCC CCCCCCCCCC CCCCCCCCCC CCCCCCCCCC CCCCCCCCCC CCCCCCCCCC CCCCCCCCCC CCCCCC |
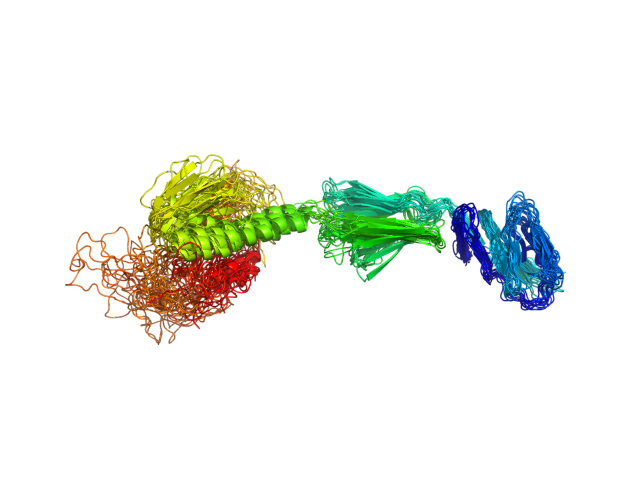
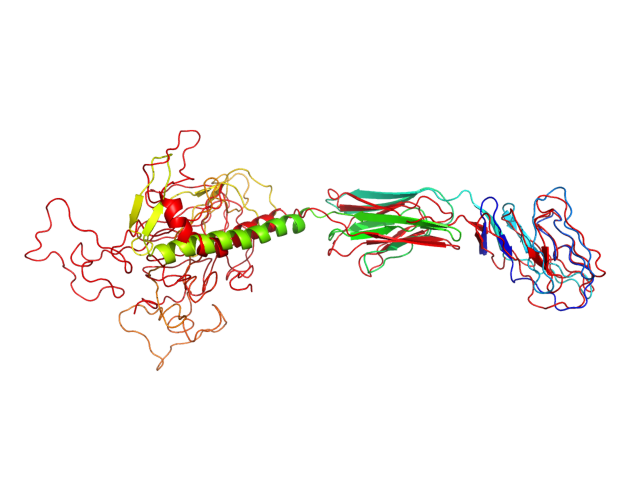
| Movie from predicted structures | To download the movie, right click on the desired file format:  
|
| Estimated finish time | 2018-Jun-11 08:05 UTC |
| Project Name |
| Project Name |
| Cluster # | 1 | 2 | 3 | 4 | 5 | 6 | 7 | 8 | 9 | 10 | 11 | 12 |
| Cluster density | 180.6 | 144.0 | 129.0 | 95.3 | 93.9 | 68.7 | 66.9 | 60.0 | 54.1 | 48.3 | 38.2 | 35.0 |
| Cluster size | 357 | 284 | 267 | 190 | 176 | 125 | 138 | 123 | 107 | 90 | 77 | 66 |
| Average cluster RMSD | 2.0 | 2.0 | 2.1 | 2.0 | 1.9 | 1.8 | 2.1 | 2.0 | 2.0 | 1.9 | 2.0 | 1.9 |
| # | 1 | 2 | 3 | 4 | 5 | 6 | 7 | 8 | 9 | 10 | 11 | 12 |
| RMSD | 11.40 | 10.60 | 10.30 | 11.30 | 9.58 | 8.26 | 6.27 | 8.78 | 7.79 | 9.05 | 5.72 | 6.48 |
| GDT_TS | 0.31 | 0.38 | 0.36 | 0.30 | 0.38 | 0.36 | 0.45 | 0.35 | 0.37 | 0.39 | 0.40 | 0.44 |
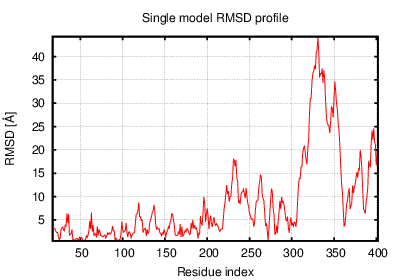
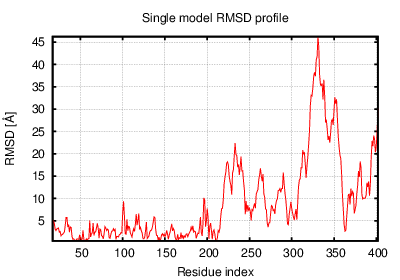
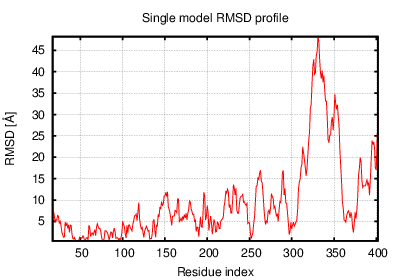
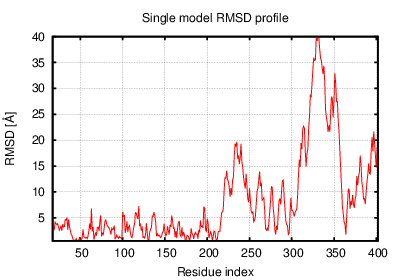
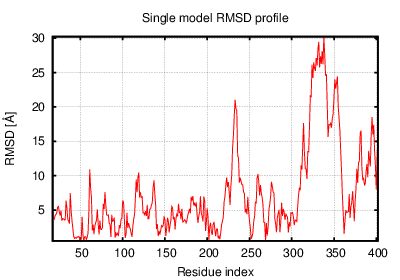
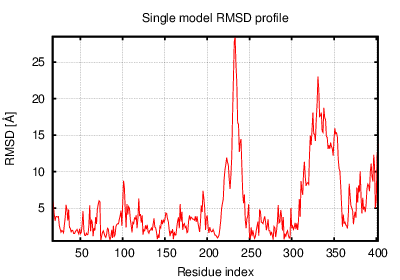
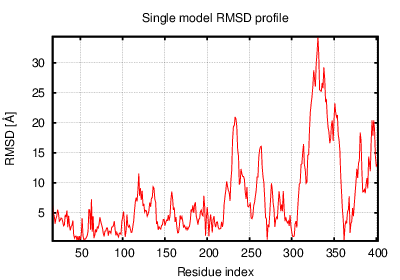
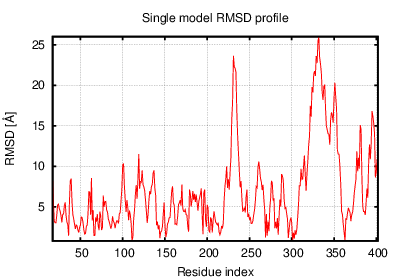
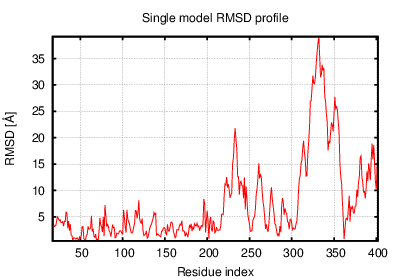
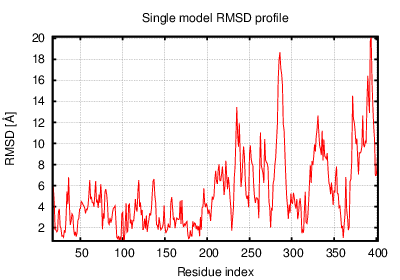
The table contains RMSD and GDT_TS values (calculated on the Cα atoms) between the predicted models and the input structure. Note that GDT_TS metric is intended as a more accurate measurement than the more common RMSD.
Read more about the root-mean-square deviation (RMSD) measure
Read more about the global distance test (GDT, also written as GDT_TS to represent "total score") measure.
| # | 1 | 2 | 3 | 4 | 5 | 6 | 7 | 8 | 9 | 10 | 11 | 12 |
| 1 | 0.00 | 3.92 | 3.34 | 4.46 | 4.10 | 6.30 | 8.71 | 5.65 | 6.89 | 5.39 | 11.00 | 9.13 |
| 2 | 3.92 | 0.00 | 3.76 | 5.51 | 2.95 | 5.48 | 7.86 | 4.64 | 5.67 | 4.65 | 9.91 | 8.10 |
| 3 | 3.34 | 3.76 | 0.00 | 4.78 | 3.29 | 5.55 | 7.60 | 4.85 | 5.68 | 4.96 | 10.50 | 7.82 |
| 4 | 4.46 | 5.51 | 4.78 | 0.00 | 5.06 | 6.50 | 8.20 | 6.02 | 7.57 | 5.39 | 10.80 | 9.23 |
| 5 | 4.10 | 2.95 | 3.29 | 5.06 | 0.00 | 4.43 | 6.69 | 3.67 | 4.64 | 3.78 | 9.25 | 7.14 |
| 6 | 6.30 | 5.48 | 5.55 | 6.50 | 4.43 | 0.00 | 4.73 | 3.41 | 3.92 | 3.28 | 7.79 | 5.77 |
| 7 | 8.71 | 7.86 | 7.60 | 8.20 | 6.69 | 4.73 | 0.00 | 5.42 | 5.23 | 5.53 | 6.41 | 4.90 |
| 8 | 5.65 | 4.64 | 4.85 | 6.02 | 3.67 | 3.41 | 5.42 | 0.00 | 3.87 | 3.26 | 8.47 | 5.93 |
| 9 | 6.89 | 5.67 | 5.68 | 7.57 | 4.64 | 3.92 | 5.23 | 3.87 | 0.00 | 4.73 | 7.97 | 4.77 |
| 10 | 5.39 | 4.65 | 4.96 | 5.39 | 3.78 | 3.28 | 5.53 | 3.26 | 4.73 | 0.00 | 8.62 | 6.84 |
| 11 | 11.00 | 9.91 | 10.50 | 10.80 | 9.25 | 7.79 | 6.41 | 8.47 | 7.97 | 8.62 | 0.00 | 7.02 |
| 12 | 9.13 | 8.10 | 7.82 | 9.23 | 7.14 | 5.77 | 4.90 | 5.93 | 4.77 | 6.84 | 7.02 | 0.00 |
The table contains RMSD values (calculated on the Cα atoms) between the predicted models.
Read more about the root-mean-square deviation (RMSD) measure.
| # | 1 | 2 | 3 | 4 | 5 | 6 | 7 | 8 | 9 | 10 | 11 | 12 |
| 1 | 1.00 | 0.52 | 0.58 | 0.51 | 0.51 | 0.45 | 0.40 | 0.52 | 0.45 | 0.51 | 0.36 | 0.43 |
| 2 | 0.52 | 1.00 | 0.53 | 0.43 | 0.61 | 0.47 | 0.37 | 0.53 | 0.49 | 0.50 | 0.37 | 0.45 |
| 3 | 0.58 | 0.53 | 1.00 | 0.46 | 0.60 | 0.48 | 0.41 | 0.49 | 0.47 | 0.52 | 0.35 | 0.44 |
| 4 | 0.51 | 0.43 | 0.46 | 1.00 | 0.44 | 0.38 | 0.36 | 0.41 | 0.38 | 0.43 | 0.31 | 0.36 |
| 5 | 0.51 | 0.61 | 0.60 | 0.44 | 1.00 | 0.54 | 0.41 | 0.59 | 0.54 | 0.59 | 0.37 | 0.48 |
| 6 | 0.45 | 0.47 | 0.48 | 0.38 | 0.54 | 1.00 | 0.46 | 0.59 | 0.58 | 0.61 | 0.36 | 0.49 |
| 7 | 0.40 | 0.37 | 0.41 | 0.36 | 0.41 | 0.46 | 1.00 | 0.44 | 0.43 | 0.47 | 0.42 | 0.52 |
| 8 | 0.52 | 0.53 | 0.49 | 0.41 | 0.59 | 0.59 | 0.44 | 1.00 | 0.56 | 0.60 | 0.36 | 0.48 |
| 9 | 0.45 | 0.49 | 0.47 | 0.38 | 0.54 | 0.58 | 0.43 | 0.56 | 1.00 | 0.54 | 0.37 | 0.53 |
| 10 | 0.51 | 0.50 | 0.52 | 0.43 | 0.59 | 0.61 | 0.47 | 0.60 | 0.54 | 1.00 | 0.36 | 0.51 |
| 11 | 0.36 | 0.37 | 0.35 | 0.31 | 0.37 | 0.36 | 0.42 | 0.36 | 0.37 | 0.36 | 1.00 | 0.41 |
| 12 | 0.43 | 0.45 | 0.44 | 0.36 | 0.48 | 0.49 | 0.52 | 0.48 | 0.53 | 0.51 | 0.41 | 1.00 |
The table contains GDT_TS values (calculated on the Cα atoms) between the predicted models.
Read more about the global distance test (GDT, also written as GDT_TS to represent "total score") measure.
© Laboratory of Theory of Biopolymers, Faculty of Chemistry, University of Warsaw 2013