Status: Done started: 2018-Nov-06 09:01:26 UTC
| Project Name | |
| Sequence | VGCSVDFSKK ETRCGTGVFV YNDVEAWRDR YKYHPDSPRR LAAAVKQAWE DGICGISSVS RMENIMWRSV EGELNAILEE NGVQLTVVVG SVKNPMWRAP QRLPVPVNEL PHGWKAWGKS YFVRAAKTNN SFVVDGDTLK ECPLKHRAWN SFLVEDHGFG VFHTSVWLKV REDYSLECDP AVIGTAVKGK EAVHSDLGYW IESEKNDTWR LKRAHLIEMK TCEWPKSHTL WTDGIEESDL IIPKSLAGPL SHHNTREGYR TQMKGPWHSE ELEIRFEECP GTKVHVEETC GTRGPSLRST TASGRVIEEW CCRECTMPPL SFRAKDGCWY GMEIRPRKEP ESNLVRSMVT A |
| Secondary structure | CEEEEECCCC EEEEECCCCC CCCCCCCCCC CEEEECCHHH HHHHHHHHHH CCCCEECCCC HHHHHHHHHH HHHHHHHHHH CCCCCEEEEC CCCCCCCCCC CCCCCCCCCC CCCCCCCCCC CCCCCCCCCC EEEECCCCCC CCCCCCEECC CEEEEEEEEC CCCCEEEEEE CCCCCCCCCC CCCEEEEECC EEEEECCCEE EEEEECCCEE EEEEEECCCC CCCCCCCCCC CCCCCCCCCC CCCCCCCCCC CCCCCCCCCC CCCCCCCCCC CEEEEECCCC CCEEEECCCC CCCCCCCCCC CCCCCCCCEE EECCCCCCCE EEEECCEEEE CCCEEECCCC CCCCCCCCCC C |
| Movie from predicted structures | To download the movie, right click on the desired file format:  
|
| Estimated finish time | 2018-Nov-06 13:06 UTC |
| Project Name |
| Project Name |
| Cluster # | 1 | 2 | 3 | 4 | 5 | 6 | 7 | 8 | 9 | 10 | 11 | 12 |
| Cluster density | 189.3 | 151.9 | 150.7 | 144.8 | 136.8 | 127.4 | 116.7 | 114.6 | 74.5 | 71.7 | 54.6 | 54.4 |
| Cluster size | 285 | 222 | 223 | 214 | 212 | 173 | 155 | 156 | 104 | 107 | 74 | 75 |
| Average cluster RMSD | 1.5 | 1.5 | 1.5 | 1.5 | 1.6 | 1.4 | 1.3 | 1.4 | 1.4 | 1.5 | 1.4 | 1.4 |
| # | 1 | 2 | 3 | 4 | 5 | 6 | 7 | 8 | 9 | 10 | 11 | 12 |
| RMSD | 5.94 | 4.58 | 5.61 | 5.31 | 5.81 | 5.20 | 5.20 | 5.20 | 5.44 | 5.23 | 5.85 | 4.61 |
| GDT_TS | 0.60 | 0.59 | 0.61 | 0.61 | 0.61 | 0.57 | 0.59 | 0.59 | 0.61 | 0.62 | 0.60 | 0.63 |
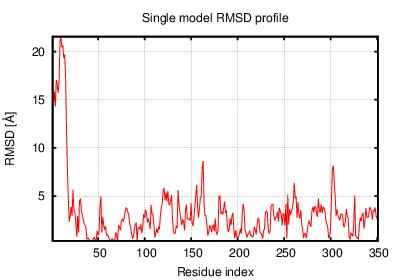
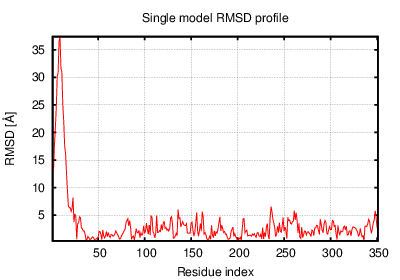
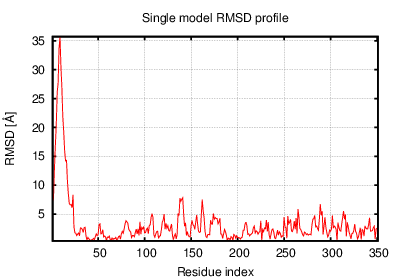
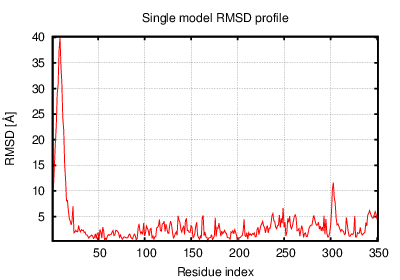
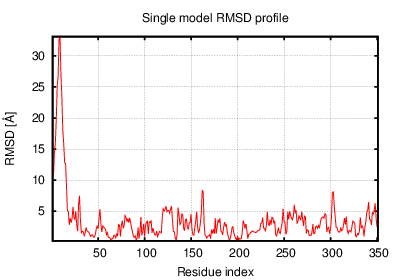
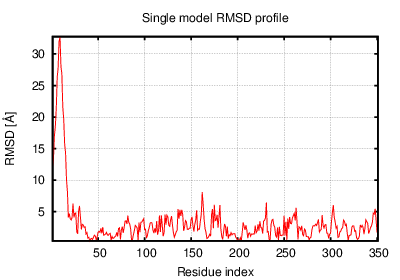
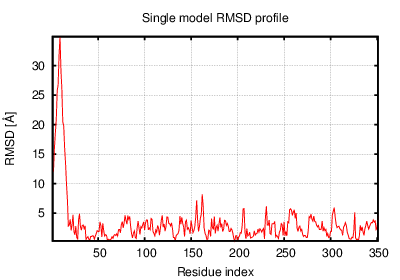
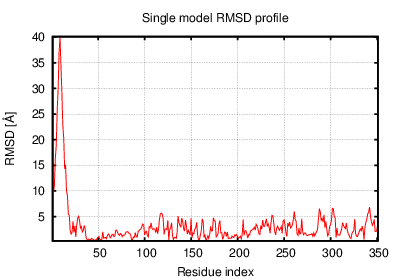
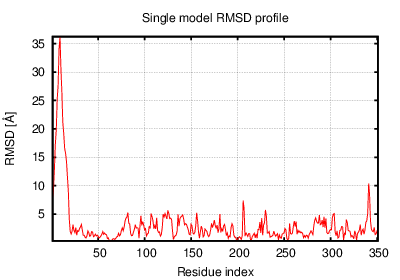
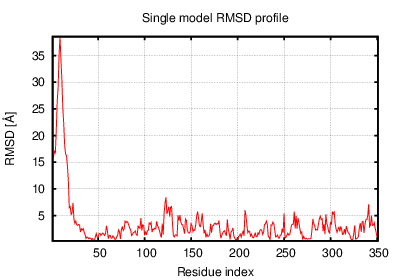
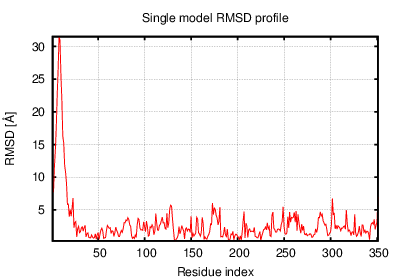
The table contains RMSD and GDT_TS values (calculated on the Cα atoms) between the predicted models and the input structure. Note that GDT_TS metric is intended as a more accurate measurement than the more common RMSD.
Read more about the root-mean-square deviation (RMSD) measure
Read more about the global distance test (GDT, also written as GDT_TS to represent "total score") measure.
| # | 1 | 2 | 3 | 4 | 5 | 6 | 7 | 8 | 9 | 10 | 11 | 12 |
| 1 | 0.00 | 3.78 | 3.38 | 4.10 | 2.96 | 3.15 | 3.81 | 3.53 | 3.26 | 4.02 | 4.21 | 3.60 |
| 2 | 3.78 | 0.00 | 3.34 | 3.80 | 3.42 | 2.99 | 3.05 | 3.09 | 3.67 | 3.80 | 3.90 | 3.30 |
| 3 | 3.38 | 3.34 | 0.00 | 2.72 | 2.82 | 2.61 | 2.52 | 2.44 | 3.11 | 2.76 | 3.01 | 2.86 |
| 4 | 4.10 | 3.80 | 2.72 | 0.00 | 3.58 | 3.07 | 2.95 | 2.95 | 3.71 | 2.73 | 2.70 | 2.96 |
| 5 | 2.96 | 3.42 | 2.82 | 3.58 | 0.00 | 2.87 | 3.31 | 3.15 | 2.68 | 3.47 | 3.66 | 3.04 |
| 6 | 3.15 | 2.99 | 2.61 | 3.07 | 2.87 | 0.00 | 2.76 | 2.68 | 3.13 | 3.31 | 3.52 | 2.75 |
| 7 | 3.81 | 3.05 | 2.52 | 2.95 | 3.31 | 2.76 | 0.00 | 2.11 | 3.71 | 2.79 | 2.94 | 3.03 |
| 8 | 3.53 | 3.09 | 2.44 | 2.95 | 3.15 | 2.68 | 2.11 | 0.00 | 3.63 | 2.85 | 3.08 | 2.98 |
| 9 | 3.26 | 3.67 | 3.11 | 3.71 | 2.68 | 3.13 | 3.71 | 3.63 | 0.00 | 3.62 | 4.11 | 2.81 |
| 10 | 4.02 | 3.80 | 2.76 | 2.73 | 3.47 | 3.31 | 2.79 | 2.85 | 3.62 | 0.00 | 2.58 | 3.07 |
| 11 | 4.21 | 3.90 | 3.01 | 2.70 | 3.66 | 3.52 | 2.94 | 3.08 | 4.11 | 2.58 | 0.00 | 3.47 |
| 12 | 3.60 | 3.30 | 2.86 | 2.96 | 3.04 | 2.75 | 3.03 | 2.98 | 2.81 | 3.07 | 3.47 | 0.00 |
The table contains RMSD values (calculated on the Cα atoms) between the predicted models.
Read more about the root-mean-square deviation (RMSD) measure.
| # | 1 | 2 | 3 | 4 | 5 | 6 | 7 | 8 | 9 | 10 | 11 | 12 |
| 1 | 1.00 | 0.67 | 0.67 | 0.60 | 0.64 | 0.67 | 0.65 | 0.69 | 0.64 | 0.63 | 0.61 | 0.62 |
| 2 | 0.67 | 1.00 | 0.66 | 0.60 | 0.67 | 0.67 | 0.67 | 0.67 | 0.65 | 0.62 | 0.63 | 0.64 |
| 3 | 0.67 | 0.66 | 1.00 | 0.68 | 0.66 | 0.68 | 0.69 | 0.67 | 0.67 | 0.64 | 0.64 | 0.65 |
| 4 | 0.60 | 0.60 | 0.68 | 1.00 | 0.59 | 0.63 | 0.64 | 0.63 | 0.66 | 0.65 | 0.66 | 0.67 |
| 5 | 0.64 | 0.67 | 0.66 | 0.59 | 1.00 | 0.62 | 0.63 | 0.65 | 0.69 | 0.61 | 0.60 | 0.66 |
| 6 | 0.67 | 0.67 | 0.68 | 0.63 | 0.62 | 1.00 | 0.70 | 0.67 | 0.64 | 0.59 | 0.62 | 0.64 |
| 7 | 0.65 | 0.67 | 0.69 | 0.64 | 0.63 | 0.70 | 1.00 | 0.73 | 0.66 | 0.66 | 0.67 | 0.65 |
| 8 | 0.69 | 0.67 | 0.67 | 0.63 | 0.65 | 0.67 | 0.73 | 1.00 | 0.62 | 0.63 | 0.63 | 0.62 |
| 9 | 0.64 | 0.65 | 0.67 | 0.66 | 0.69 | 0.64 | 0.66 | 0.62 | 1.00 | 0.66 | 0.64 | 0.70 |
| 10 | 0.63 | 0.62 | 0.64 | 0.65 | 0.61 | 0.59 | 0.66 | 0.63 | 0.66 | 1.00 | 0.69 | 0.63 |
| 11 | 0.61 | 0.63 | 0.64 | 0.66 | 0.60 | 0.62 | 0.67 | 0.63 | 0.64 | 0.69 | 1.00 | 0.65 |
| 12 | 0.62 | 0.64 | 0.65 | 0.67 | 0.66 | 0.64 | 0.65 | 0.62 | 0.70 | 0.63 | 0.65 | 1.00 |
The table contains GDT_TS values (calculated on the Cα atoms) between the predicted models.
Read more about the global distance test (GDT, also written as GDT_TS to represent "total score") measure.
© Laboratory of Theory of Biopolymers, Faculty of Chemistry, University of Warsaw 2013