Status: Done started: 2018-Nov-07 16:53:15 UTC
| Project Name | |
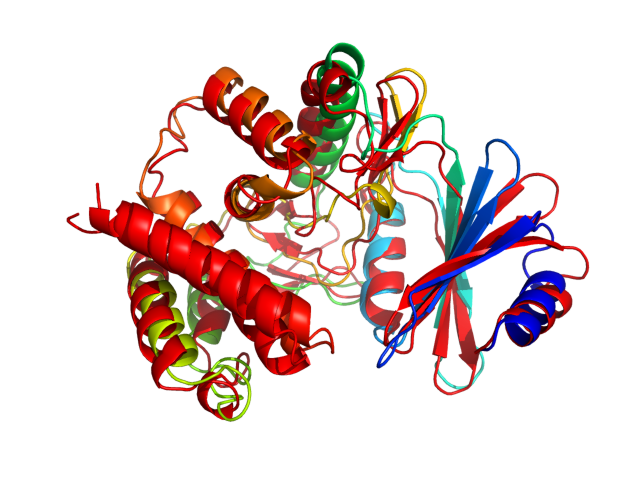
| Sequence | LTATSVEKFL IEKFDSVSDL MQLSEGEESR AFSFDVGGRG YVLRVNSCAD GFYKDRYVYR HFASAALPIP EVLDIGEFSE SLTYCISRRA QGVTLQDLPE TELPAVLQPV AEAMDAIAAA DLSQTSGFGP FGPQGIGQYT TWRDFICAIA DPHVYHWQTV MDDTVSASVA QALDELMLWA EDCPEVRHLV HADFGSNNVL TDNGRITAVI DWSEAMFGDS QYEVANIFFW RPWLACMEQQ TRYFERRHPE LAGSPRLRAY MLRIGLDQLY QSLVDGNFDD AAWAQGRCDA IVRSGAGT |
| Secondary structure | CCHHHHHHHH HHCCCCCEEE EEEEEECCEE EEEEEECCEE EEEEEECCCH HHHHHHHHHH HHCCCCCCCC CEEEEEECCC CCEEEEEECC CCEECCCCCC CCHHHHHHHH HHHHHHHHHC CCCCCCCEEE ECCCCCEEEC CHHHHHHCCC CCCCCCCCCC CCHHHHHHHH HHHHHHHHHC CCCCCCCEEE CCCCCCCCEE EECCEEEEEC CCCCCEEECH HHHHHHHHHH CCCCHHHHHH HHHHHHHCCC CCCCHHHHHH HHHHHHHHHH HHHHHCCHHH HHHHHHHHHH HHHHHCCC |
| Movie from predicted structures | To download the movie, right click on the desired file format:  
|
| Estimated finish time | 2018-Nov-07 20:51 UTC |
| Project Name |


| Project Name |
| Cluster # | 1 | 2 | 3 | 4 | 5 | 6 | 7 | 8 | 9 | 10 | 11 | 12 |
| Cluster density | 251.5 | 235.1 | 217.6 | 189.5 | 160.1 | 129.0 | 125.8 | 125.7 | 113.7 | 104.7 | 85.4 | 82.3 |
| Cluster size | 291 | 251 | 238 | 214 | 169 | 140 | 145 | 136 | 118 | 110 | 101 | 87 |
| Average cluster RMSD | 1.2 | 1.1 | 1.1 | 1.1 | 1.1 | 1.1 | 1.2 | 1.1 | 1.0 | 1.1 | 1.2 | 1.1 |
| # | 1 | 2 | 3 | 4 | 5 | 6 | 7 | 8 | 9 | 10 | 11 | 12 |
| RMSD | 3.23 | 2.93 | 3.05 | 3.08 | 3.04 | 2.90 | 3.08 | 2.77 | 3.27 | 3.16 | 3.09 | 3.29 |
| GDT_TS | 0.60 | 0.67 | 0.61 | 0.65 | 0.61 | 0.68 | 0.63 | 0.66 | 0.58 | 0.60 | 0.61 | 0.61 |
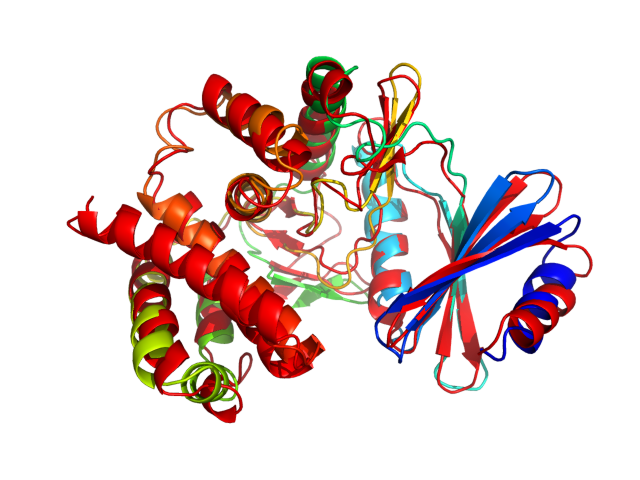
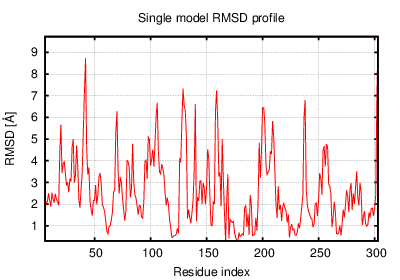
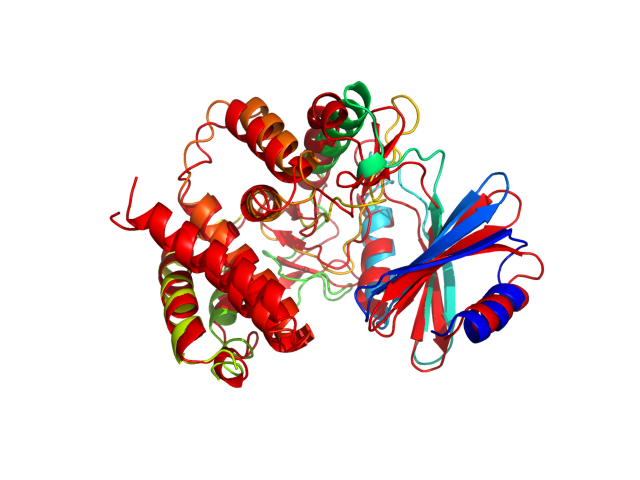
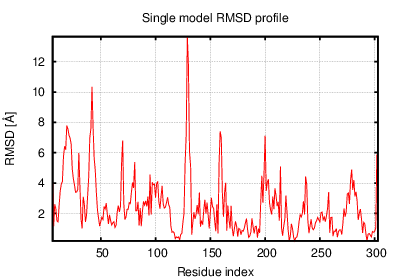
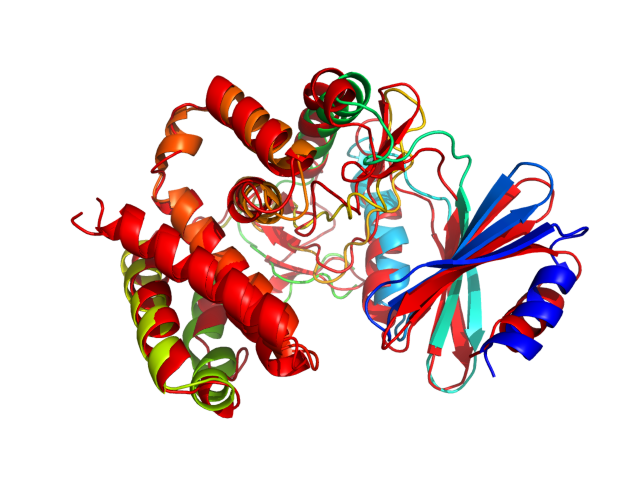
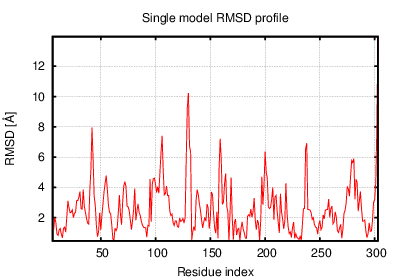
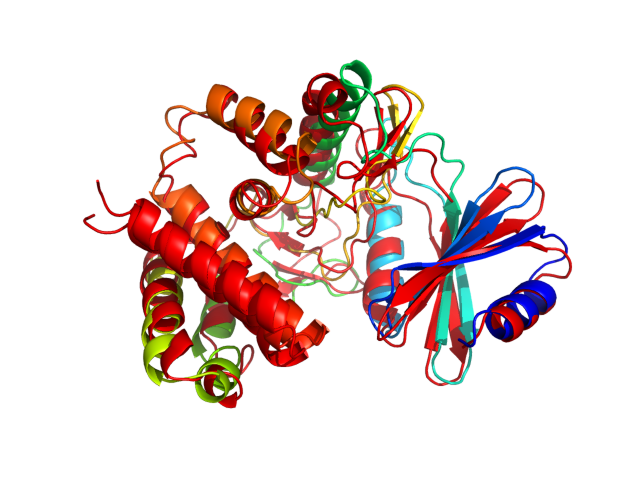
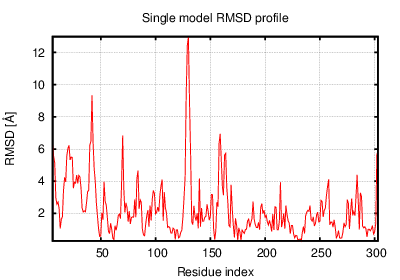
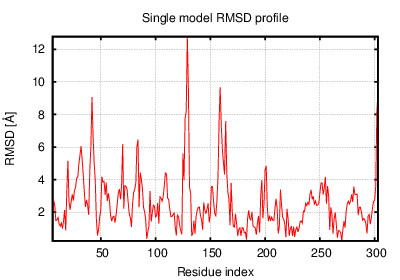
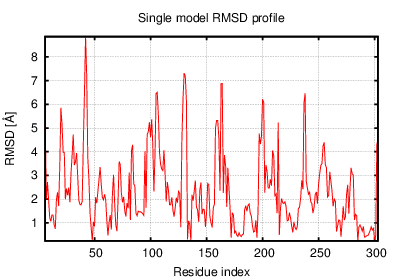
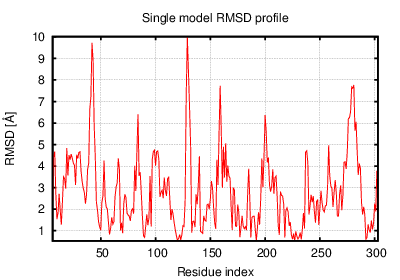
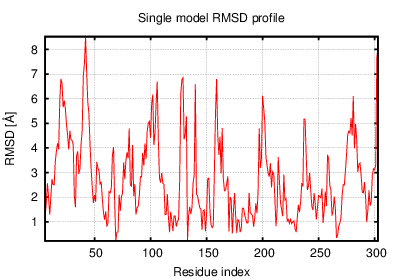
The table contains RMSD and GDT_TS values (calculated on the Cα atoms) between the predicted models and the input structure. Note that GDT_TS metric is intended as a more accurate measurement than the more common RMSD.
Read more about the root-mean-square deviation (RMSD) measure
Read more about the global distance test (GDT, also written as GDT_TS to represent "total score") measure.
| # | 1 | 2 | 3 | 4 | 5 | 6 | 7 | 8 | 9 | 10 | 11 | 12 |
| 1 | 0.00 | 2.34 | 2.38 | 2.20 | 2.15 | 2.55 | 2.61 | 2.17 | 1.95 | 1.95 | 2.92 | 1.97 |
| 2 | 2.34 | 0.00 | 2.42 | 1.96 | 2.34 | 1.55 | 1.99 | 2.22 | 2.39 | 2.38 | 2.29 | 2.53 |
| 3 | 2.38 | 2.42 | 0.00 | 2.23 | 1.96 | 2.55 | 2.35 | 1.97 | 2.39 | 2.16 | 2.55 | 2.29 |
| 4 | 2.20 | 1.96 | 2.23 | 0.00 | 2.11 | 1.98 | 2.28 | 2.08 | 2.22 | 2.01 | 2.76 | 2.47 |
| 5 | 2.15 | 2.34 | 1.96 | 2.11 | 0.00 | 2.44 | 2.42 | 1.83 | 2.30 | 2.01 | 2.67 | 2.27 |
| 6 | 2.55 | 1.55 | 2.55 | 1.98 | 2.44 | 0.00 | 2.11 | 2.47 | 2.50 | 2.55 | 2.31 | 2.78 |
| 7 | 2.61 | 1.99 | 2.35 | 2.28 | 2.42 | 2.11 | 0.00 | 2.49 | 2.39 | 2.47 | 2.00 | 2.45 |
| 8 | 2.17 | 2.22 | 1.97 | 2.08 | 1.83 | 2.47 | 2.49 | 0.00 | 2.40 | 2.28 | 2.74 | 2.47 |
| 9 | 1.95 | 2.39 | 2.39 | 2.22 | 2.30 | 2.50 | 2.39 | 2.40 | 0.00 | 2.03 | 2.66 | 1.99 |
| 10 | 1.95 | 2.38 | 2.16 | 2.01 | 2.01 | 2.55 | 2.47 | 2.28 | 2.03 | 0.00 | 2.62 | 2.10 |
| 11 | 2.92 | 2.29 | 2.55 | 2.76 | 2.67 | 2.31 | 2.00 | 2.74 | 2.66 | 2.62 | 0.00 | 2.82 |
| 12 | 1.97 | 2.53 | 2.29 | 2.47 | 2.27 | 2.78 | 2.45 | 2.47 | 1.99 | 2.10 | 2.82 | 0.00 |
The table contains RMSD values (calculated on the Cα atoms) between the predicted models.
Read more about the root-mean-square deviation (RMSD) measure.
| # | 1 | 2 | 3 | 4 | 5 | 6 | 7 | 8 | 9 | 10 | 11 | 12 |
| 1 | 1.00 | 0.71 | 0.71 | 0.71 | 0.71 | 0.68 | 0.64 | 0.72 | 0.75 | 0.75 | 0.61 | 0.74 |
| 2 | 0.71 | 1.00 | 0.71 | 0.74 | 0.71 | 0.83 | 0.74 | 0.74 | 0.69 | 0.69 | 0.71 | 0.69 |
| 3 | 0.71 | 0.71 | 1.00 | 0.74 | 0.79 | 0.71 | 0.69 | 0.77 | 0.72 | 0.72 | 0.67 | 0.71 |
| 4 | 0.71 | 0.74 | 0.74 | 1.00 | 0.73 | 0.74 | 0.68 | 0.74 | 0.70 | 0.76 | 0.63 | 0.67 |
| 5 | 0.71 | 0.71 | 0.79 | 0.73 | 1.00 | 0.70 | 0.68 | 0.79 | 0.71 | 0.74 | 0.64 | 0.70 |
| 6 | 0.68 | 0.83 | 0.71 | 0.74 | 0.70 | 1.00 | 0.74 | 0.71 | 0.69 | 0.68 | 0.72 | 0.67 |
| 7 | 0.64 | 0.74 | 0.69 | 0.68 | 0.68 | 0.74 | 1.00 | 0.69 | 0.68 | 0.66 | 0.76 | 0.69 |
| 8 | 0.72 | 0.74 | 0.77 | 0.74 | 0.79 | 0.71 | 0.69 | 1.00 | 0.69 | 0.70 | 0.65 | 0.68 |
| 9 | 0.75 | 0.69 | 0.72 | 0.70 | 0.71 | 0.69 | 0.68 | 0.69 | 1.00 | 0.73 | 0.66 | 0.75 |
| 10 | 0.75 | 0.69 | 0.72 | 0.76 | 0.74 | 0.68 | 0.66 | 0.70 | 0.73 | 1.00 | 0.64 | 0.75 |
| 11 | 0.61 | 0.71 | 0.67 | 0.63 | 0.64 | 0.72 | 0.76 | 0.65 | 0.66 | 0.64 | 1.00 | 0.63 |
| 12 | 0.74 | 0.69 | 0.71 | 0.67 | 0.70 | 0.67 | 0.69 | 0.68 | 0.75 | 0.75 | 0.63 | 1.00 |
The table contains GDT_TS values (calculated on the Cα atoms) between the predicted models.
Read more about the global distance test (GDT, also written as GDT_TS to represent "total score") measure.
© Laboratory of Theory of Biopolymers, Faculty of Chemistry, University of Warsaw 2013