Status: Done started: 2018-Jun-08 17:02:38 UTC
| Project Name | |
| Sequence | MVAGMLGLRE EKSEDQDLQG LKDKPLKFKK VKKDKKEEKE GKHEPVQPSA HHSAEPAEAG KAETSEGSGS APAVPEASAS PKQRRSIIRD RGPMYDDPTL PEGWTRKLKQ RKSGRSAGKY DVYLINPQGK AFRSKVELIA YFEKVGDTSL DPNDFDFTVT GRGS |
| Secondary structure | CCCCCCCHHH HCCCHHHHHH HCCCCCCCCC CCCCCCCCCC CCCCCCCCCC CCCCCCCCCC CCCCCCCCCC CCCCCCCCCC CCCCCCCCCC CCCCCCCCCC CCCCCEEEEC CCCCCCCCCC EEEECCCCCC CCCCHHHHHH HHCCCCCCCC CCCCCCCCCC CCCC |
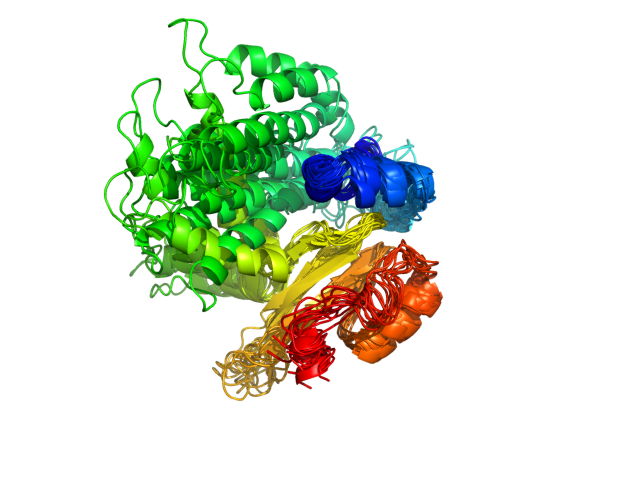
| Movie from predicted structures | To download the movie, right click on the desired file format:  
|
| Estimated finish time | 2018-Jun-08 21:43 UTC |
| Project Name |


| Project Name |
| Cluster # | 1 | 2 | 3 | 4 | 5 | 6 | 7 | 8 | 9 | 10 | 11 | 12 |
| Cluster density | 140.2 | 128.5 | 82.9 | 76.4 | 73.2 | 54.0 | 52.0 | 45.1 | 37.2 | 36.9 | 32.3 | 31.2 |
| Cluster size | 369 | 347 | 227 | 182 | 229 | 129 | 124 | 103 | 72 | 79 | 56 | 83 |
| Average cluster RMSD | 2.6 | 2.7 | 2.7 | 2.4 | 3.1 | 2.4 | 2.4 | 2.3 | 1.9 | 2.1 | 1.7 | 2.7 |
| # | 1 | 2 | 3 | 4 | 5 | 6 | 7 | 8 | 9 | 10 | 11 | 12 |
| RMSD | 13.30 | 13.80 | 13.20 | 15.70 | 13.40 | 9.10 | 11.00 | 11.10 | 11.30 | 7.98 | 11.00 | 9.52 |
| GDT_TS | 0.38 | 0.35 | 0.36 | 0.37 | 0.38 | 0.39 | 0.40 | 0.38 | 0.42 | 0.38 | 0.40 | 0.38 |
The table contains RMSD and GDT_TS values (calculated on the Cα atoms) between the predicted models and the input structure. Note that GDT_TS metric is intended as a more accurate measurement than the more common RMSD.
Read more about the root-mean-square deviation (RMSD) measure
Read more about the global distance test (GDT, also written as GDT_TS to represent "total score") measure.
| # | 1 | 2 | 3 | 4 | 5 | 6 | 7 | 8 | 9 | 10 | 11 | 12 |
| 1 | 0.00 | 3.44 | 3.35 | 5.03 | 4.95 | 6.74 | 5.09 | 7.32 | 7.11 | 9.44 | 6.43 | 8.40 |
| 2 | 3.44 | 0.00 | 3.18 | 3.71 | 3.96 | 6.68 | 5.28 | 6.16 | 6.09 | 9.36 | 5.76 | 7.89 |
| 3 | 3.35 | 3.18 | 0.00 | 4.54 | 3.51 | 6.42 | 4.93 | 6.18 | 6.30 | 8.74 | 6.21 | 7.33 |
| 4 | 5.03 | 3.71 | 4.54 | 0.00 | 4.28 | 8.51 | 7.14 | 7.27 | 6.58 | 11.20 | 7.09 | 9.09 |
| 5 | 4.95 | 3.96 | 3.51 | 4.28 | 0.00 | 6.74 | 5.52 | 5.98 | 5.36 | 9.27 | 6.25 | 7.11 |
| 6 | 6.74 | 6.68 | 6.42 | 8.51 | 6.74 | 0.00 | 3.84 | 5.88 | 5.25 | 5.53 | 4.08 | 5.63 |
| 7 | 5.09 | 5.28 | 4.93 | 7.14 | 5.52 | 3.84 | 0.00 | 6.14 | 5.32 | 7.23 | 4.54 | 6.51 |
| 8 | 7.32 | 6.16 | 6.18 | 7.27 | 5.98 | 5.88 | 6.14 | 0.00 | 4.42 | 6.32 | 5.47 | 4.13 |
| 9 | 7.11 | 6.09 | 6.30 | 6.58 | 5.36 | 5.25 | 5.32 | 4.42 | 0.00 | 7.46 | 3.90 | 5.37 |
| 10 | 9.44 | 9.36 | 8.74 | 11.20 | 9.27 | 5.53 | 7.23 | 6.32 | 7.46 | 0.00 | 6.84 | 4.37 |
| 11 | 6.43 | 5.76 | 6.21 | 7.09 | 6.25 | 4.08 | 4.54 | 5.47 | 3.90 | 6.84 | 0.00 | 5.85 |
| 12 | 8.40 | 7.89 | 7.33 | 9.09 | 7.11 | 5.63 | 6.51 | 4.13 | 5.37 | 4.37 | 5.85 | 0.00 |
The table contains RMSD values (calculated on the Cα atoms) between the predicted models.
Read more about the root-mean-square deviation (RMSD) measure.
| # | 1 | 2 | 3 | 4 | 5 | 6 | 7 | 8 | 9 | 10 | 11 | 12 |
| 1 | 1.00 | 0.64 | 0.62 | 0.57 | 0.59 | 0.52 | 0.55 | 0.47 | 0.47 | 0.43 | 0.52 | 0.49 |
| 2 | 0.64 | 1.00 | 0.68 | 0.62 | 0.63 | 0.54 | 0.57 | 0.50 | 0.50 | 0.47 | 0.54 | 0.47 |
| 3 | 0.62 | 0.68 | 1.00 | 0.59 | 0.63 | 0.51 | 0.50 | 0.43 | 0.47 | 0.44 | 0.54 | 0.43 |
| 4 | 0.57 | 0.62 | 0.59 | 1.00 | 0.60 | 0.51 | 0.51 | 0.48 | 0.49 | 0.45 | 0.55 | 0.45 |
| 5 | 0.59 | 0.63 | 0.63 | 0.60 | 1.00 | 0.49 | 0.53 | 0.47 | 0.49 | 0.44 | 0.53 | 0.48 |
| 6 | 0.52 | 0.54 | 0.51 | 0.51 | 0.49 | 1.00 | 0.65 | 0.56 | 0.63 | 0.51 | 0.63 | 0.52 |
| 7 | 0.55 | 0.57 | 0.50 | 0.51 | 0.53 | 0.65 | 1.00 | 0.52 | 0.56 | 0.46 | 0.54 | 0.48 |
| 8 | 0.47 | 0.50 | 0.43 | 0.48 | 0.47 | 0.56 | 0.52 | 1.00 | 0.59 | 0.56 | 0.56 | 0.58 |
| 9 | 0.47 | 0.50 | 0.47 | 0.49 | 0.49 | 0.63 | 0.56 | 0.59 | 1.00 | 0.47 | 0.62 | 0.49 |
| 10 | 0.43 | 0.47 | 0.44 | 0.45 | 0.44 | 0.51 | 0.46 | 0.56 | 0.47 | 1.00 | 0.47 | 0.62 |
| 11 | 0.52 | 0.54 | 0.54 | 0.55 | 0.53 | 0.63 | 0.54 | 0.56 | 0.62 | 0.47 | 1.00 | 0.49 |
| 12 | 0.49 | 0.47 | 0.43 | 0.45 | 0.48 | 0.52 | 0.48 | 0.58 | 0.49 | 0.62 | 0.49 | 1.00 |
The table contains GDT_TS values (calculated on the Cα atoms) between the predicted models.
Read more about the global distance test (GDT, also written as GDT_TS to represent "total score") measure.
© Laboratory of Theory of Biopolymers, Faculty of Chemistry, University of Warsaw 2013