Status: Done started: 2018-Aug-12 08:12:52 UTC
| Project Name | |
| Sequence | MNKAKRLEIL TRLRENNPHP TTELNFSSPF ELLIAVLLSA QATDVSVNKA TAKLYPVANT PAAMLELGVE GVKTYIKTIG LYNSKAENII KTCRILLEQH NGEVPEDRAA MEALPGVGRK TANVVRNTAF GDPEVAVDTH IFRVCNRTQF APGKNVEQVE EKLLKVVPAE FKVDCHHWLI LHGRYTCIAR KPRCGSCIIE DLCEYKEKVD I |
| Secondary structure | CCHHHHHHHH HHHHHHCCCC CCCCCCCCHH HHHHHHHHCC CCCHHHHHHH HHHHCCCCCC HHHHHHHHHH HHHHHCCCCC CHHHHHHHHH HHHHHHHHHC CCCCCCCHHH HHCCCCCCHH HHHHHHHHHH CCCCCCCCHH HHHHHHHCCC CCCCCHHHHH HHHHHHCCCC CCCCHHHHHH HHHHHCCCCC CCCCCCCCCC CCCCCCCCCC C |
| Movie from predicted structures | To download the movie, right click on the desired file format:  
|
| Estimated finish time | 2018-Aug-12 12:59 UTC |
| Project Name |


| Project Name |
| Cluster # | 1 | 2 | 3 | 4 | 5 | 6 | 7 | 8 | 9 | 10 | 11 | 12 |
| Cluster density | 199.4 | 151.5 | 146.9 | 141.5 | 139.9 | 126.5 | 123.4 | 118.8 | 115.2 | 112.6 | 107.6 | 81.8 |
| Cluster size | 262 | 193 | 182 | 188 | 181 | 159 | 158 | 164 | 154 | 142 | 122 | 95 |
| Average cluster RMSD | 1.3 | 1.3 | 1.2 | 1.3 | 1.3 | 1.3 | 1.3 | 1.4 | 1.3 | 1.3 | 1.1 | 1.2 |
| # | 1 | 2 | 3 | 4 | 5 | 6 | 7 | 8 | 9 | 10 | 11 | 12 |
| RMSD | 2.49 | 2.54 | 2.47 | 2.51 | 2.69 | 2.66 | 2.52 | 2.63 | 2.60 | 2.43 | 2.83 | 2.64 |
| GDT_TS | 0.66 | 0.65 | 0.68 | 0.65 | 0.65 | 0.64 | 0.66 | 0.66 | 0.65 | 0.68 | 0.63 | 0.66 |
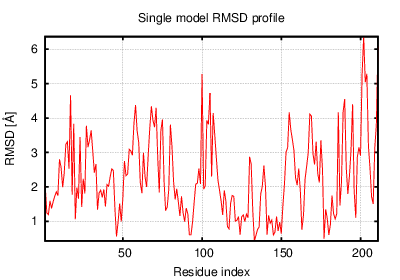
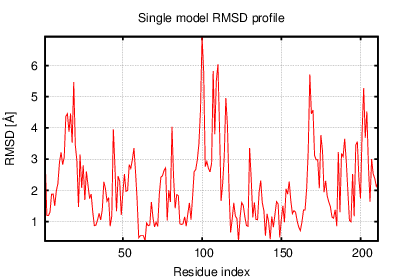
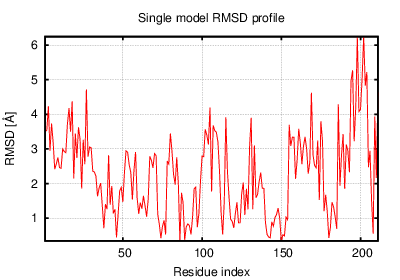
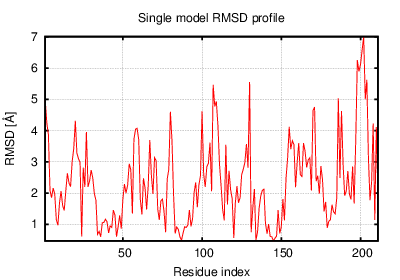
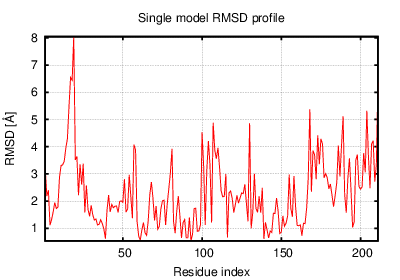
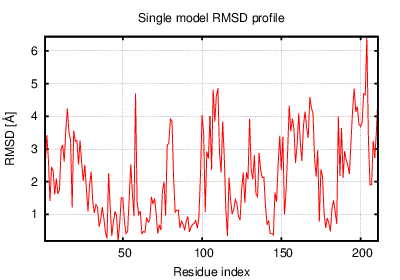
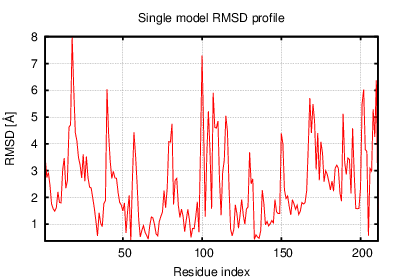
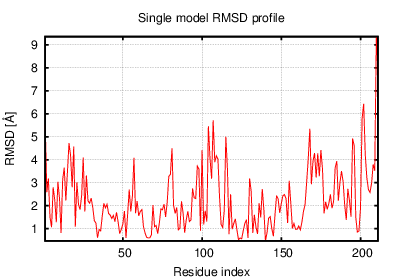
The table contains RMSD and GDT_TS values (calculated on the Cα atoms) between the predicted models and the input structure. Note that GDT_TS metric is intended as a more accurate measurement than the more common RMSD.
Read more about the root-mean-square deviation (RMSD) measure
Read more about the global distance test (GDT, also written as GDT_TS to represent "total score") measure.
| # | 1 | 2 | 3 | 4 | 5 | 6 | 7 | 8 | 9 | 10 | 11 | 12 |
| 1 | 0.00 | 2.02 | 1.92 | 2.29 | 2.39 | 2.58 | 2.21 | 2.71 | 2.55 | 2.69 | 2.42 | 2.39 |
| 2 | 2.02 | 0.00 | 2.43 | 1.90 | 2.66 | 2.17 | 2.38 | 2.22 | 2.31 | 2.43 | 2.98 | 2.82 |
| 3 | 1.92 | 2.43 | 0.00 | 2.52 | 2.02 | 2.68 | 1.91 | 2.69 | 2.61 | 2.59 | 2.06 | 2.32 |
| 4 | 2.29 | 1.90 | 2.52 | 0.00 | 2.69 | 1.86 | 2.53 | 2.10 | 2.17 | 2.10 | 2.92 | 2.76 |
| 5 | 2.39 | 2.66 | 2.02 | 2.69 | 0.00 | 2.73 | 2.01 | 3.00 | 2.86 | 2.79 | 2.11 | 2.61 |
| 6 | 2.58 | 2.17 | 2.68 | 1.86 | 2.73 | 0.00 | 2.50 | 2.10 | 1.93 | 2.08 | 2.97 | 2.89 |
| 7 | 2.21 | 2.38 | 1.91 | 2.53 | 2.01 | 2.50 | 0.00 | 2.69 | 2.58 | 2.89 | 2.21 | 2.40 |
| 8 | 2.71 | 2.22 | 2.69 | 2.10 | 3.00 | 2.10 | 2.69 | 0.00 | 1.98 | 2.25 | 3.26 | 3.16 |
| 9 | 2.55 | 2.31 | 2.61 | 2.17 | 2.86 | 1.93 | 2.58 | 1.98 | 0.00 | 2.02 | 2.90 | 2.84 |
| 10 | 2.69 | 2.43 | 2.59 | 2.10 | 2.79 | 2.08 | 2.89 | 2.25 | 2.02 | 0.00 | 2.98 | 2.99 |
| 11 | 2.42 | 2.98 | 2.06 | 2.92 | 2.11 | 2.97 | 2.21 | 3.26 | 2.90 | 2.98 | 0.00 | 2.14 |
| 12 | 2.39 | 2.82 | 2.32 | 2.76 | 2.61 | 2.89 | 2.40 | 3.16 | 2.84 | 2.99 | 2.14 | 0.00 |
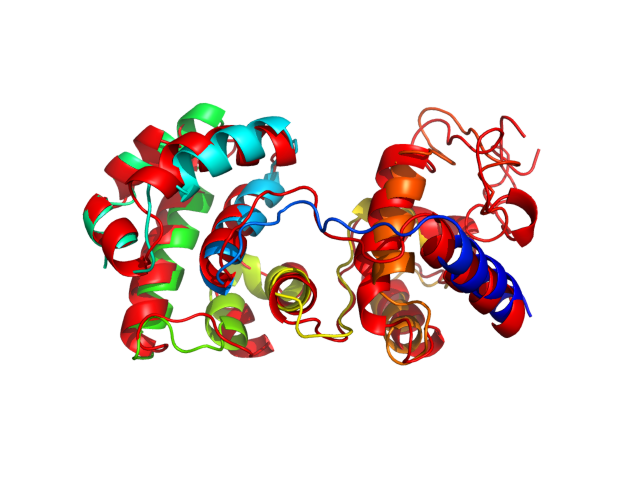
The table contains RMSD values (calculated on the Cα atoms) between the predicted models.
Read more about the root-mean-square deviation (RMSD) measure.
| # | 1 | 2 | 3 | 4 | 5 | 6 | 7 | 8 | 9 | 10 | 11 | 12 |
| 1 | 1.00 | 0.74 | 0.74 | 0.70 | 0.70 | 0.67 | 0.70 | 0.67 | 0.67 | 0.67 | 0.68 | 0.70 |
| 2 | 0.74 | 1.00 | 0.67 | 0.77 | 0.66 | 0.71 | 0.67 | 0.71 | 0.68 | 0.68 | 0.60 | 0.63 |
| 3 | 0.74 | 0.67 | 1.00 | 0.66 | 0.74 | 0.64 | 0.75 | 0.68 | 0.67 | 0.68 | 0.75 | 0.72 |
| 4 | 0.70 | 0.77 | 0.66 | 1.00 | 0.65 | 0.76 | 0.69 | 0.73 | 0.72 | 0.73 | 0.62 | 0.65 |
| 5 | 0.70 | 0.66 | 0.74 | 0.65 | 1.00 | 0.65 | 0.71 | 0.64 | 0.68 | 0.67 | 0.75 | 0.69 |
| 6 | 0.67 | 0.71 | 0.64 | 0.76 | 0.65 | 1.00 | 0.68 | 0.76 | 0.75 | 0.73 | 0.59 | 0.63 |
| 7 | 0.70 | 0.67 | 0.75 | 0.69 | 0.71 | 0.68 | 1.00 | 0.67 | 0.71 | 0.66 | 0.70 | 0.73 |
| 8 | 0.67 | 0.71 | 0.68 | 0.73 | 0.64 | 0.76 | 0.67 | 1.00 | 0.75 | 0.72 | 0.63 | 0.62 |
| 9 | 0.67 | 0.68 | 0.67 | 0.72 | 0.68 | 0.75 | 0.71 | 0.75 | 1.00 | 0.74 | 0.63 | 0.65 |
| 10 | 0.67 | 0.68 | 0.68 | 0.73 | 0.67 | 0.73 | 0.66 | 0.72 | 0.74 | 1.00 | 0.62 | 0.64 |
| 11 | 0.68 | 0.60 | 0.75 | 0.62 | 0.75 | 0.59 | 0.70 | 0.63 | 0.63 | 0.62 | 1.00 | 0.76 |
| 12 | 0.70 | 0.63 | 0.72 | 0.65 | 0.69 | 0.63 | 0.73 | 0.62 | 0.65 | 0.64 | 0.76 | 1.00 |
The table contains GDT_TS values (calculated on the Cα atoms) between the predicted models.
Read more about the global distance test (GDT, also written as GDT_TS to represent "total score") measure.
© Laboratory of Theory of Biopolymers, Faculty of Chemistry, University of Warsaw 2013