Status: Done started: 2018-Oct-20 00:57:20 UTC
| Project Name | |
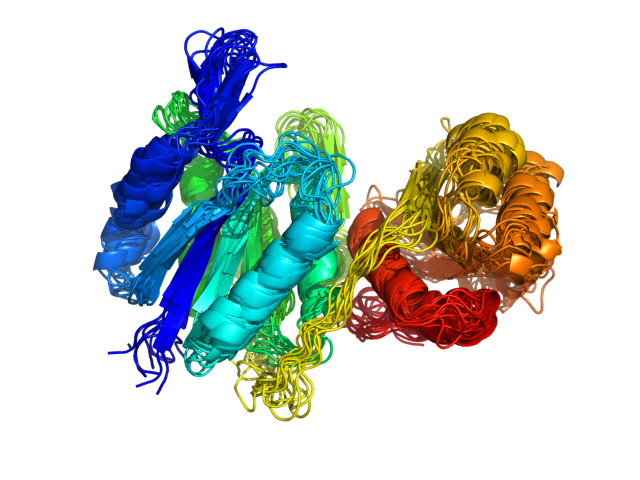
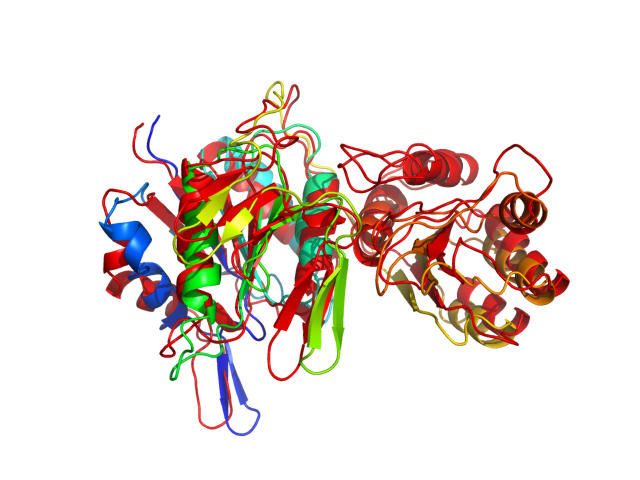
| Sequence | MTRKHIYIAY TGGTIGMQKS DHGYVPVAGF MEKQLASMPE FHRPEMPEYT IHEYEPLIDS SDMTPADWQQ IADDIRDNYD KYDGFVILHG TDTMAYTASA LSFMLENLGK PVIVTGSQIP LAELRSDGQA NLLNALHIAA NYPINEVTLF FNNQLMRGNR STKSHADGFN AFTSPNLPPL LEAGINIQIS SNITVGAKPE GDFKVHNITP QPIGVITMYP GISHEVIRNT LRQPVNAMIL LTFGVGNAPQ NPELLGHLKE ASERGVIVVN LTQCLAGKVN MGGYATGCAL ADSGVISGFD MTPEAALAKL HYLLSQDLSY EEIKQKMQEV LRGEMSL |
| Secondary structure | CCCCEEEEEE CCCCCCCEEC CCCEECCCCH HHHHHHHCCC CCCCCCCEEE EEECCCCCCC CCCCHHHHHH HHHHHHHHCC CCCEEEEECC CCCHHHHHHH HHHHEECCCC CEEEECCCCC CCCCCCHHHH HHHHHHHHHH HCCCCCEEEE ECCEEEECCC CEEEECCCCC EEECCCCCCC EEECCCEEEC CCCCCCCCCC CCCEECCCCC CCEEEEECCC CCCHHHHHHH HCCCCCEEEE EECCCCCCCC CHHHHHHHHH HHHHCCEEEE EECCCCCCCC CCCCCCCCHH HHCCCEECCC CCHHHHHHHH HHHHHCCCCH HHHHHHHHCC CCCCCCC |
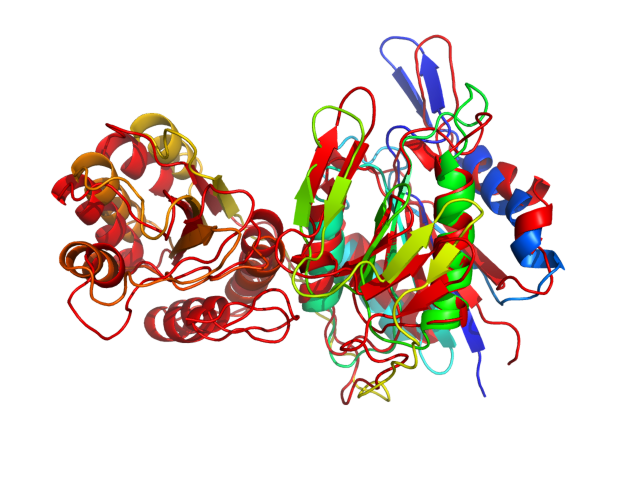
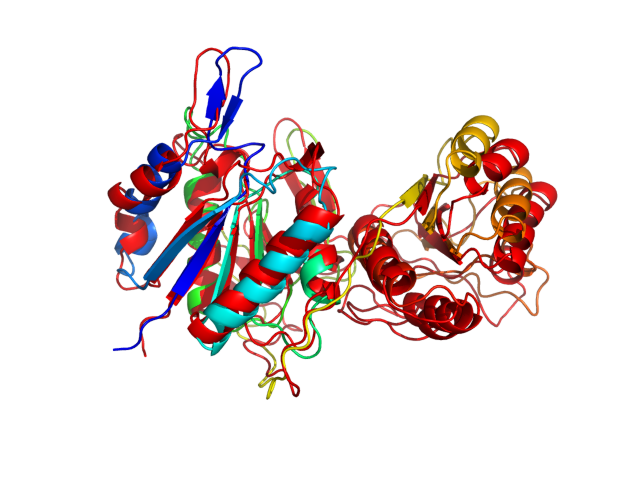
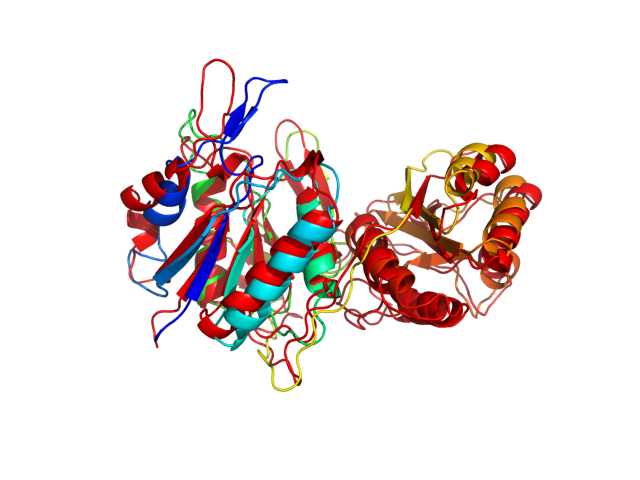
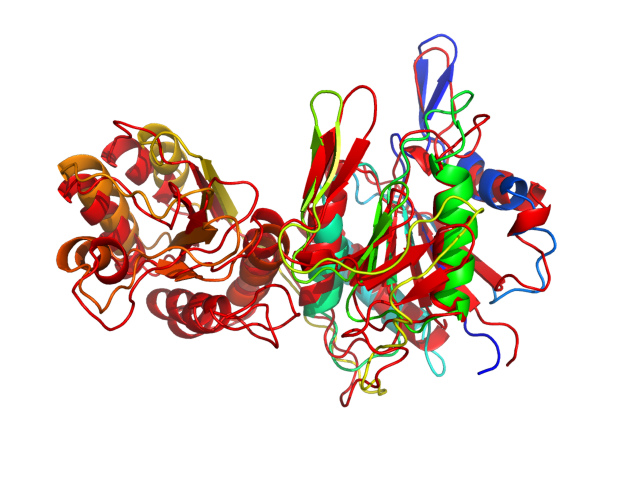
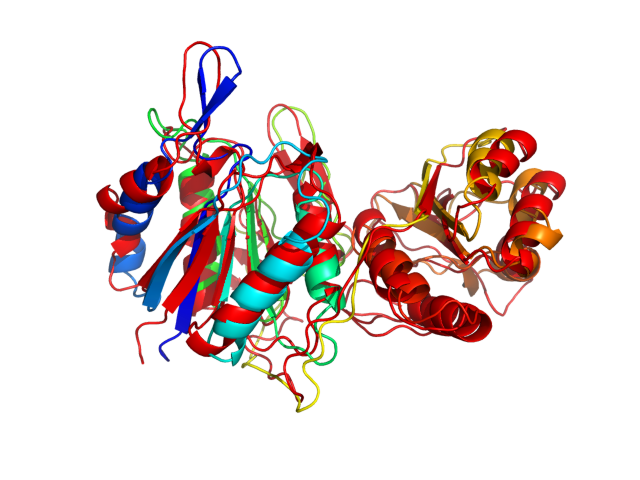
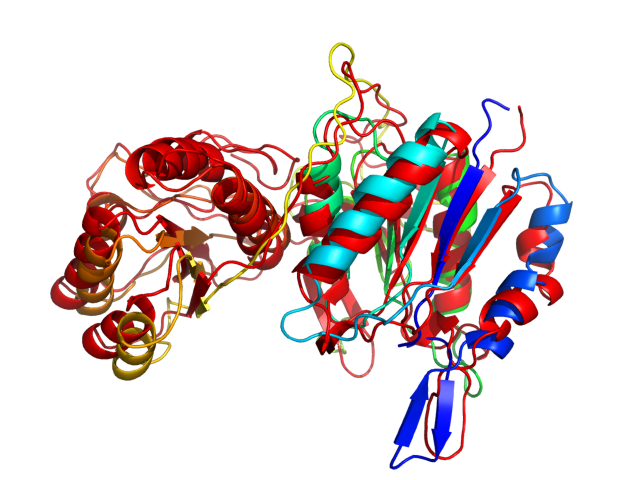
| Movie from predicted structures | To download the movie, right click on the desired file format:  
|
| Estimated finish time | 2018-Oct-20 06:00 UTC |
| Project Name |


| Project Name |
| Cluster # | 1 | 2 | 3 | 4 | 5 | 6 | 7 | 8 | 9 | 10 | 11 | 12 |
| Cluster density | 192.1 | 136.9 | 122.7 | 117.0 | 115.9 | 110.9 | 97.4 | 92.7 | 92.6 | 78.9 | 78.1 | 58.0 |
| Cluster size | 307 | 226 | 181 | 178 | 193 | 173 | 154 | 136 | 138 | 115 | 118 | 81 |
| Average cluster RMSD | 1.6 | 1.7 | 1.5 | 1.5 | 1.7 | 1.6 | 1.6 | 1.5 | 1.5 | 1.5 | 1.5 | 1.4 |
| # | 1 | 2 | 3 | 4 | 5 | 6 | 7 | 8 | 9 | 10 | 11 | 12 |
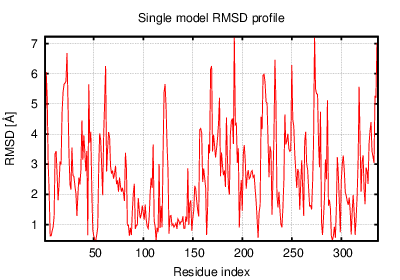
| RMSD | 3.11 | 2.98 | 3.62 | 3.40 | 2.94 | 3.24 | 3.26 | 2.84 | 2.67 | 2.96 | 3.49 | 3.05 |
| GDT_TS | 0.59 | 0.64 | 0.56 | 0.58 | 0.63 | 0.59 | 0.59 | 0.63 | 0.65 | 0.59 | 0.56 | 0.60 |
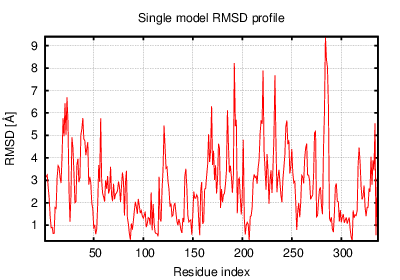
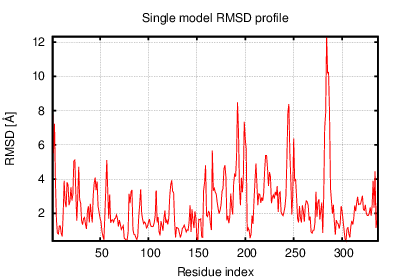
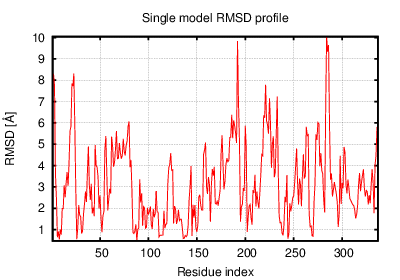
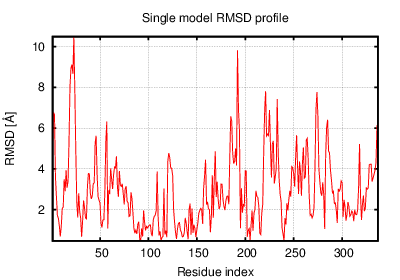
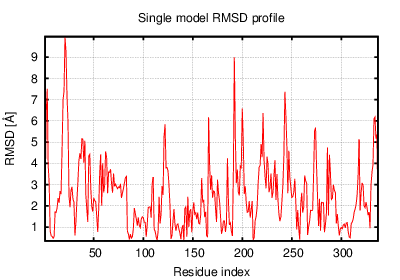
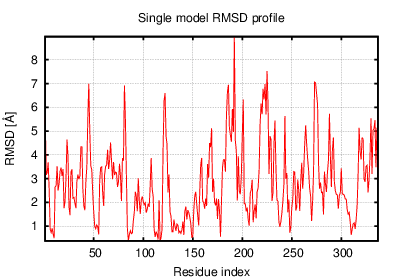
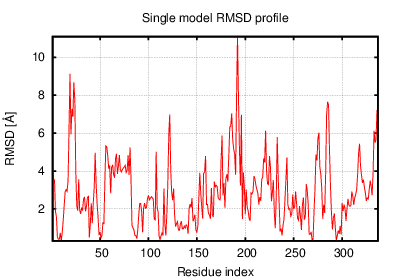
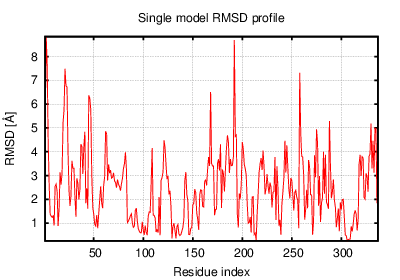
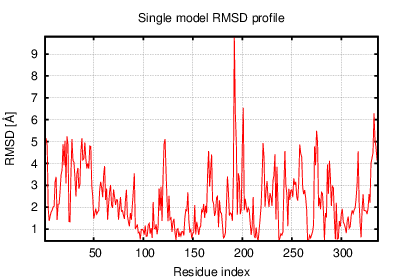
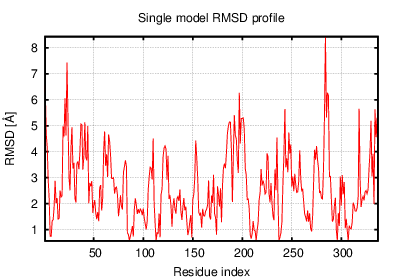
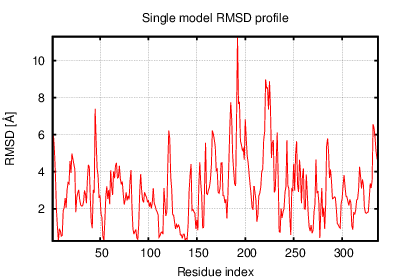
The table contains RMSD and GDT_TS values (calculated on the Cα atoms) between the predicted models and the input structure. Note that GDT_TS metric is intended as a more accurate measurement than the more common RMSD.
Read more about the root-mean-square deviation (RMSD) measure
Read more about the global distance test (GDT, also written as GDT_TS to represent "total score") measure.
| # | 1 | 2 | 3 | 4 | 5 | 6 | 7 | 8 | 9 | 10 | 11 | 12 |
| 1 | 0.00 | 2.96 | 2.80 | 2.85 | 2.53 | 2.69 | 2.52 | 2.78 | 2.68 | 2.74 | 2.63 | 2.70 |
| 2 | 2.96 | 0.00 | 3.26 | 3.60 | 3.02 | 3.04 | 3.07 | 3.07 | 2.85 | 3.17 | 3.16 | 3.26 |
| 3 | 2.80 | 3.26 | 0.00 | 2.39 | 3.03 | 2.53 | 2.27 | 2.66 | 2.88 | 3.15 | 2.58 | 2.68 |
| 4 | 2.85 | 3.60 | 2.39 | 0.00 | 2.90 | 2.68 | 2.44 | 2.89 | 2.97 | 3.32 | 2.85 | 2.44 |
| 5 | 2.53 | 3.02 | 3.03 | 2.90 | 0.00 | 2.94 | 2.63 | 2.55 | 2.26 | 2.64 | 2.76 | 2.59 |
| 6 | 2.69 | 3.04 | 2.53 | 2.68 | 2.94 | 0.00 | 2.41 | 2.83 | 2.86 | 3.21 | 2.62 | 2.59 |
| 7 | 2.52 | 3.07 | 2.27 | 2.44 | 2.63 | 2.41 | 0.00 | 2.57 | 2.70 | 2.88 | 2.60 | 2.43 |
| 8 | 2.78 | 3.07 | 2.66 | 2.89 | 2.55 | 2.83 | 2.57 | 0.00 | 2.18 | 2.37 | 2.89 | 2.75 |
| 9 | 2.68 | 2.85 | 2.88 | 2.97 | 2.26 | 2.86 | 2.70 | 2.18 | 0.00 | 2.61 | 2.96 | 2.80 |
| 10 | 2.74 | 3.17 | 3.15 | 3.32 | 2.64 | 3.21 | 2.88 | 2.37 | 2.61 | 0.00 | 3.16 | 2.93 |
| 11 | 2.63 | 3.16 | 2.58 | 2.85 | 2.76 | 2.62 | 2.60 | 2.89 | 2.96 | 3.16 | 0.00 | 2.87 |
| 12 | 2.70 | 3.26 | 2.68 | 2.44 | 2.59 | 2.59 | 2.43 | 2.75 | 2.80 | 2.93 | 2.87 | 0.00 |
The table contains RMSD values (calculated on the Cα atoms) between the predicted models.
Read more about the root-mean-square deviation (RMSD) measure.
| # | 1 | 2 | 3 | 4 | 5 | 6 | 7 | 8 | 9 | 10 | 11 | 12 |
| 1 | 1.00 | 0.62 | 0.65 | 0.67 | 0.68 | 0.68 | 0.69 | 0.64 | 0.66 | 0.63 | 0.68 | 0.66 |
| 2 | 0.62 | 1.00 | 0.59 | 0.60 | 0.65 | 0.61 | 0.62 | 0.62 | 0.65 | 0.61 | 0.61 | 0.59 |
| 3 | 0.65 | 0.59 | 1.00 | 0.72 | 0.64 | 0.69 | 0.71 | 0.68 | 0.61 | 0.61 | 0.66 | 0.67 |
| 4 | 0.67 | 0.60 | 0.72 | 1.00 | 0.68 | 0.69 | 0.71 | 0.66 | 0.62 | 0.60 | 0.65 | 0.71 |
| 5 | 0.68 | 0.65 | 0.64 | 0.68 | 1.00 | 0.65 | 0.69 | 0.67 | 0.70 | 0.68 | 0.68 | 0.67 |
| 6 | 0.68 | 0.61 | 0.69 | 0.69 | 0.65 | 1.00 | 0.71 | 0.65 | 0.62 | 0.59 | 0.68 | 0.67 |
| 7 | 0.69 | 0.62 | 0.71 | 0.71 | 0.69 | 0.71 | 1.00 | 0.68 | 0.66 | 0.63 | 0.69 | 0.70 |
| 8 | 0.64 | 0.62 | 0.68 | 0.66 | 0.67 | 0.65 | 0.68 | 1.00 | 0.70 | 0.70 | 0.64 | 0.65 |
| 9 | 0.66 | 0.65 | 0.61 | 0.62 | 0.70 | 0.62 | 0.66 | 0.70 | 1.00 | 0.67 | 0.63 | 0.62 |
| 10 | 0.63 | 0.61 | 0.61 | 0.60 | 0.68 | 0.59 | 0.63 | 0.70 | 0.67 | 1.00 | 0.61 | 0.61 |
| 11 | 0.68 | 0.61 | 0.66 | 0.65 | 0.68 | 0.68 | 0.69 | 0.64 | 0.63 | 0.61 | 1.00 | 0.65 |
| 12 | 0.66 | 0.59 | 0.67 | 0.71 | 0.67 | 0.67 | 0.70 | 0.65 | 0.62 | 0.61 | 0.65 | 1.00 |
The table contains GDT_TS values (calculated on the Cα atoms) between the predicted models.
Read more about the global distance test (GDT, also written as GDT_TS to represent "total score") measure.
© Laboratory of Theory of Biopolymers, Faculty of Chemistry, University of Warsaw 2013