Status: Done started: 2018-Oct-11 11:35:17 UTC
| Project Name | |
| Sequence | LPSGSDPAFS QPKSVLDAGL TCQGASPSSV SKPILLVPGT GTTGPQSFDS NWIPLSTQLG YTPCWISPPP FMLNDTQVNT EYMVNAITAL YAGSGNNKLP VLTWSQGGLV AQWGLTFFPS IRSKVDRLMA FAPDYKGTVL AGPLDALAVS APSVWQQTTG SALTTALRNA GGLTQIVPTT NLYSATDEIV QPQVSNSPLD SSYLFNGKNV QAQAVCGPLF VIDHAGSLTS QFSYVVGRSA LRSTTGQARS ADYGITDCNP LPANDLTPEQ KVAAAALLAP AAAAIVAGPK QNCEPDLMPY ARPFAVGKRT CSGIVTP |
| Secondary structure | CCCCCCCCCC CCHHHHHCCE EECCCCCCCC CCEEEEECCC CCCHHHHHCC CHHHHHHCCC CEEEEECCCC CCCCCHHHHH HHHHHHHHHH HHHCCCCCEE EEEECHHHHH HHHHHHHCCC CCCCEEEEEE ECCCCCCCCC CHHHHHCCCC CHHHHHCCCC CHHHHHHHHC CCCCCCCCEE EEECCCCCCC CCCCCCCCCC CCCCCCCEEE ECCCCCCCCC CCCCCHHHHC HHHHHHHHHH HHCCCCCCCC CCCCCCCCCC CCCCCCCHHH HHHHHCCHHH HHHHHHHCCC CCCCCCCCCC CCCCCCCCEE CCEECCC |
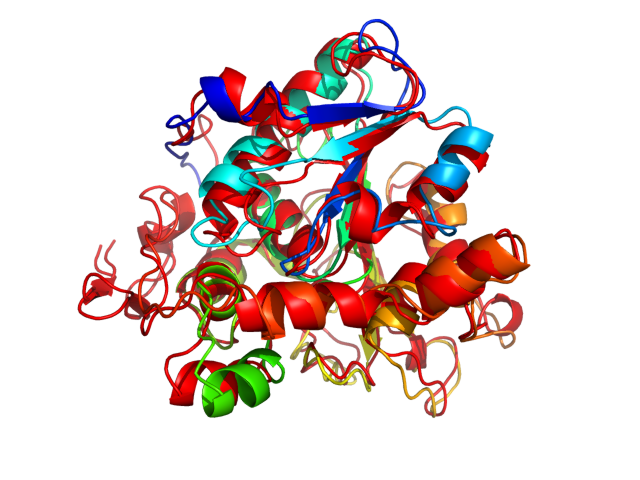
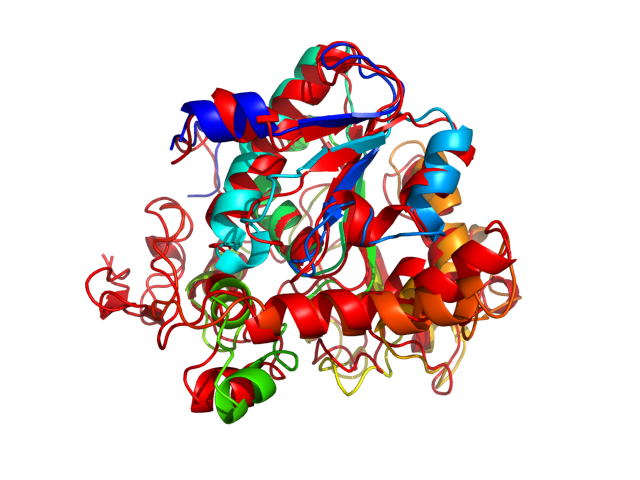
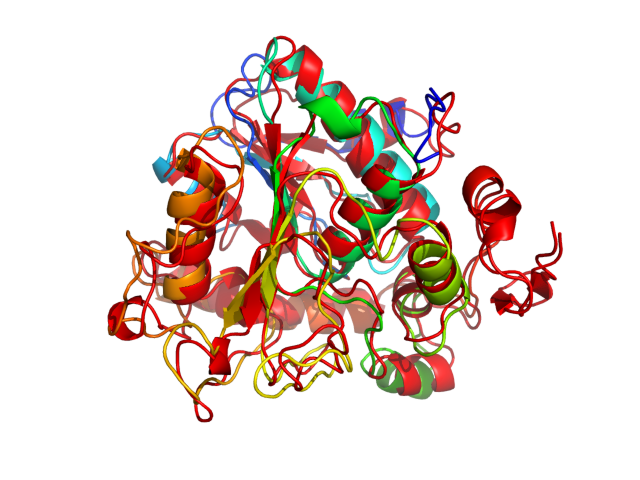
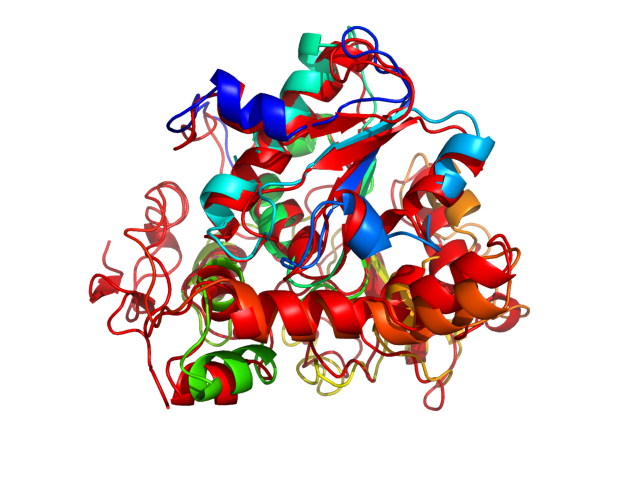
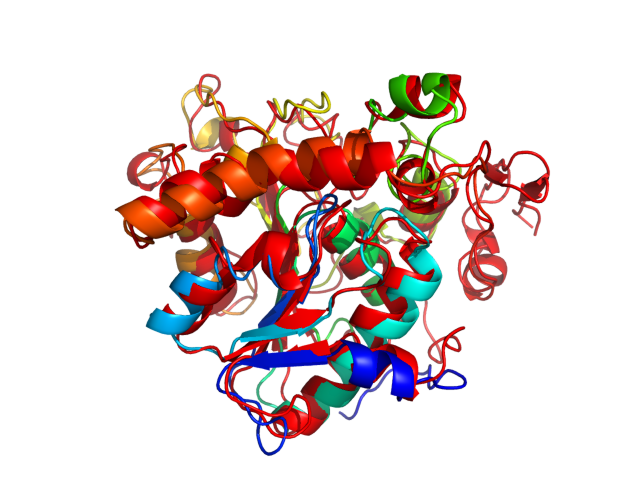
| Movie from predicted structures | To download the movie, right click on the desired file format:  
|
| Estimated finish time | 2018-Oct-11 16:36 UTC |
| Project Name |


| Project Name |
| Cluster # | 1 | 2 | 3 | 4 | 5 | 6 | 7 | 8 | 9 | 10 | 11 | 12 |
| Cluster density | 222.6 | 194.3 | 160.6 | 151.7 | 140.2 | 120.6 | 118.3 | 117.3 | 107.9 | 79.8 | 79.1 | 70.2 |
| Cluster size | 280 | 258 | 220 | 201 | 180 | 157 | 139 | 140 | 143 | 94 | 106 | 82 |
| Average cluster RMSD | 1.3 | 1.3 | 1.4 | 1.3 | 1.3 | 1.3 | 1.2 | 1.2 | 1.3 | 1.2 | 1.3 | 1.2 |
| # | 1 | 2 | 3 | 4 | 5 | 6 | 7 | 8 | 9 | 10 | 11 | 12 |
| RMSD | 2.38 | 2.26 | 2.35 | 2.29 | 2.51 | 2.19 | 2.29 | 2.73 | 2.38 | 2.32 | 3.33 | 2.94 |
| GDT_TS | 0.71 | 0.72 | 0.70 | 0.70 | 0.68 | 0.72 | 0.70 | 0.68 | 0.69 | 0.71 | 0.69 | 0.68 |
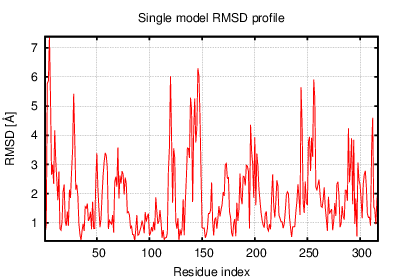
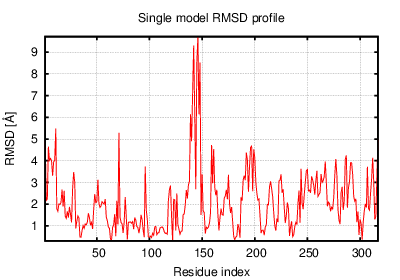
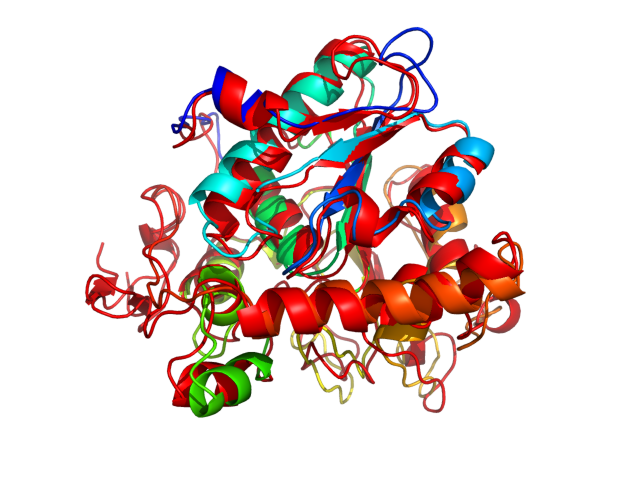
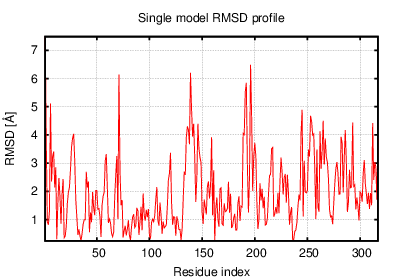
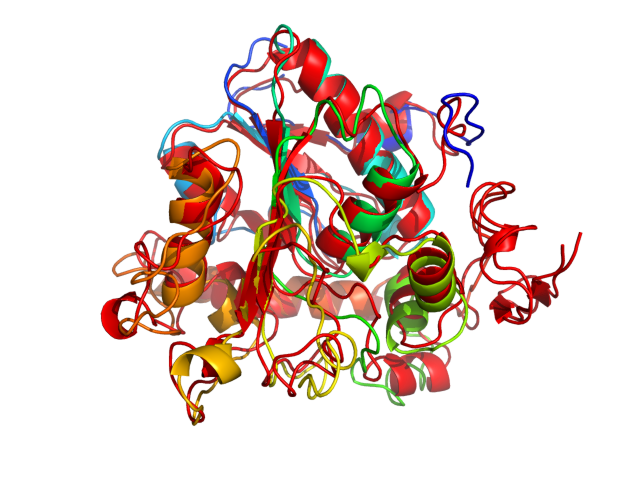
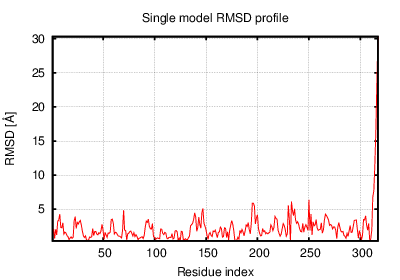
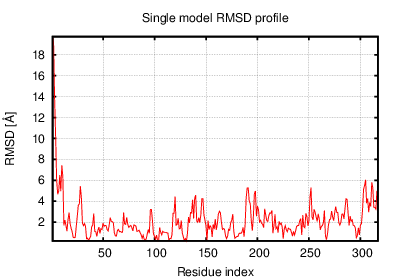
The table contains RMSD and GDT_TS values (calculated on the Cα atoms) between the predicted models and the input structure. Note that GDT_TS metric is intended as a more accurate measurement than the more common RMSD.
Read more about the root-mean-square deviation (RMSD) measure
Read more about the global distance test (GDT, also written as GDT_TS to represent "total score") measure.
| # | 1 | 2 | 3 | 4 | 5 | 6 | 7 | 8 | 9 | 10 | 11 | 12 |
| 1 | 0.00 | 2.10 | 2.30 | 2.13 | 2.30 | 2.04 | 1.89 | 2.34 | 2.35 | 2.18 | 3.62 | 3.10 |
| 2 | 2.10 | 0.00 | 2.23 | 2.13 | 2.33 | 2.15 | 2.14 | 2.46 | 2.08 | 2.15 | 3.51 | 3.04 |
| 3 | 2.30 | 2.23 | 0.00 | 2.32 | 2.40 | 2.43 | 2.31 | 2.73 | 2.54 | 2.29 | 3.32 | 3.22 |
| 4 | 2.13 | 2.13 | 2.32 | 0.00 | 2.22 | 2.21 | 2.27 | 2.37 | 2.09 | 2.37 | 3.51 | 2.60 |
| 5 | 2.30 | 2.33 | 2.40 | 2.22 | 0.00 | 2.08 | 2.16 | 2.42 | 2.19 | 2.13 | 3.53 | 2.90 |
| 6 | 2.04 | 2.15 | 2.43 | 2.21 | 2.08 | 0.00 | 1.94 | 2.12 | 2.33 | 1.82 | 3.45 | 3.00 |
| 7 | 1.89 | 2.14 | 2.31 | 2.27 | 2.16 | 1.94 | 0.00 | 2.16 | 2.19 | 2.09 | 3.63 | 2.93 |
| 8 | 2.34 | 2.46 | 2.73 | 2.37 | 2.42 | 2.12 | 2.16 | 0.00 | 2.33 | 2.37 | 3.62 | 3.03 |
| 9 | 2.35 | 2.08 | 2.54 | 2.09 | 2.19 | 2.33 | 2.19 | 2.33 | 0.00 | 2.29 | 3.42 | 2.90 |
| 10 | 2.18 | 2.15 | 2.29 | 2.37 | 2.13 | 1.82 | 2.09 | 2.37 | 2.29 | 0.00 | 3.43 | 2.98 |
| 11 | 3.62 | 3.51 | 3.32 | 3.51 | 3.53 | 3.45 | 3.63 | 3.62 | 3.42 | 3.43 | 0.00 | 3.96 |
| 12 | 3.10 | 3.04 | 3.22 | 2.60 | 2.90 | 3.00 | 2.93 | 3.03 | 2.90 | 2.98 | 3.96 | 0.00 |
The table contains RMSD values (calculated on the Cα atoms) between the predicted models.
Read more about the root-mean-square deviation (RMSD) measure.
| # | 1 | 2 | 3 | 4 | 5 | 6 | 7 | 8 | 9 | 10 | 11 | 12 |
| 1 | 1.00 | 0.73 | 0.70 | 0.71 | 0.72 | 0.74 | 0.76 | 0.73 | 0.71 | 0.73 | 0.68 | 0.69 |
| 2 | 0.73 | 1.00 | 0.73 | 0.73 | 0.71 | 0.71 | 0.73 | 0.70 | 0.73 | 0.72 | 0.69 | 0.70 |
| 3 | 0.70 | 0.73 | 1.00 | 0.67 | 0.68 | 0.68 | 0.70 | 0.68 | 0.68 | 0.69 | 0.71 | 0.65 |
| 4 | 0.71 | 0.73 | 0.67 | 1.00 | 0.73 | 0.73 | 0.71 | 0.73 | 0.75 | 0.69 | 0.68 | 0.75 |
| 5 | 0.72 | 0.71 | 0.68 | 0.73 | 1.00 | 0.75 | 0.72 | 0.71 | 0.74 | 0.73 | 0.66 | 0.71 |
| 6 | 0.74 | 0.71 | 0.68 | 0.73 | 0.75 | 1.00 | 0.76 | 0.73 | 0.71 | 0.79 | 0.67 | 0.69 |
| 7 | 0.76 | 0.73 | 0.70 | 0.71 | 0.72 | 0.76 | 1.00 | 0.71 | 0.72 | 0.75 | 0.67 | 0.69 |
| 8 | 0.73 | 0.70 | 0.68 | 0.73 | 0.71 | 0.73 | 0.71 | 1.00 | 0.72 | 0.72 | 0.66 | 0.68 |
| 9 | 0.71 | 0.73 | 0.68 | 0.75 | 0.74 | 0.71 | 0.72 | 0.72 | 1.00 | 0.72 | 0.67 | 0.71 |
| 10 | 0.73 | 0.72 | 0.69 | 0.69 | 0.73 | 0.79 | 0.75 | 0.72 | 0.72 | 1.00 | 0.68 | 0.70 |
| 11 | 0.68 | 0.69 | 0.71 | 0.68 | 0.66 | 0.67 | 0.67 | 0.66 | 0.67 | 0.68 | 1.00 | 0.67 |
| 12 | 0.69 | 0.70 | 0.65 | 0.75 | 0.71 | 0.69 | 0.69 | 0.68 | 0.71 | 0.70 | 0.67 | 1.00 |
The table contains GDT_TS values (calculated on the Cα atoms) between the predicted models.
Read more about the global distance test (GDT, also written as GDT_TS to represent "total score") measure.
© Laboratory of Theory of Biopolymers, Faculty of Chemistry, University of Warsaw 2013